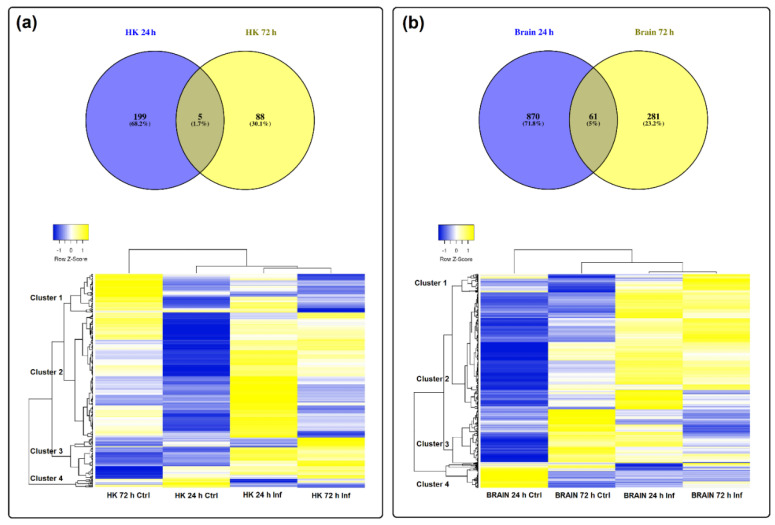
Figure 4.
Modulation of lncRNAs in (a) head kidney and (b) brain after nodavirus challenge. Venn diagrams represent the number of shared and unshared lncRNAs significantly modulated at each sampling point (FC > 2, FDR < 0.05). Heat maps of the lncRNAs significantly affected by the infection in each tissue and hierarchical clustering of the different samples constructed with the TPM values.

