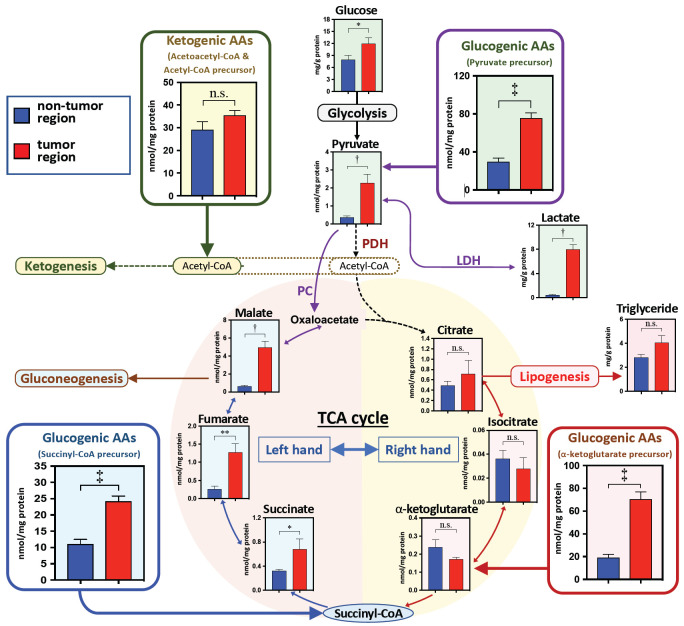
Figure 2.
The metabolite levels in the amino acid (AA)-related metabolism in the nontumor and tumor regions. The sum of categorized AAs are presented by the metabolic precursors: pyruvate precursor (Ser + Gly + Thr + Ala + Tyr + Cys), acetyl-CoA precursor (Leu + Lys + Phe + Tyr + Ile + Trp), succinyl-CoA precursor (Val + Ile + Met + Thr), and α-ketoglutarate precursor (Glu + Gln + Arg + Pro). The concentrations of AAs and metabolites are presented as the tissue total protein level (nmol/mg total protein) and as the mean ± the standard error. *P<0.05, **P<0.01, †P<0.001, and ‡P<0.0001 indicate the significant difference levels, analyzed using the paired Student’s t-test. Abbreviation: AA, amino acid; LDH, lactate dehydrogenase; PC, pyruvate carboxylase.

