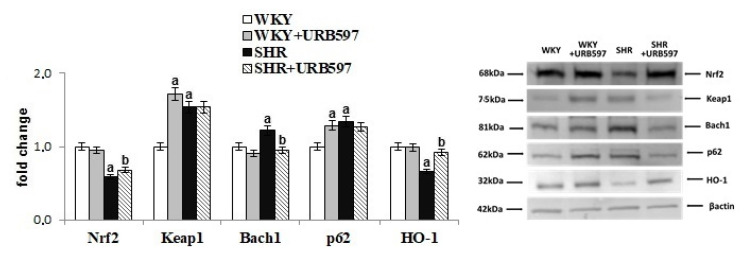
Figure 2.
The levels of Nrf2 and its activator (p62) and inhibitors (Keap1, Bach1) as well as HO-1 in the brain of spontaneously hypertensive rats and hypertensive rats after URB597 administration. The expression of the examined proteins is shown compared to the control groups. Data points represent the mean ± SD, n = 6; (a, significantly different from the WKY group, p < 0.05; b, significantly different from the SHR group, p < 0.05).

