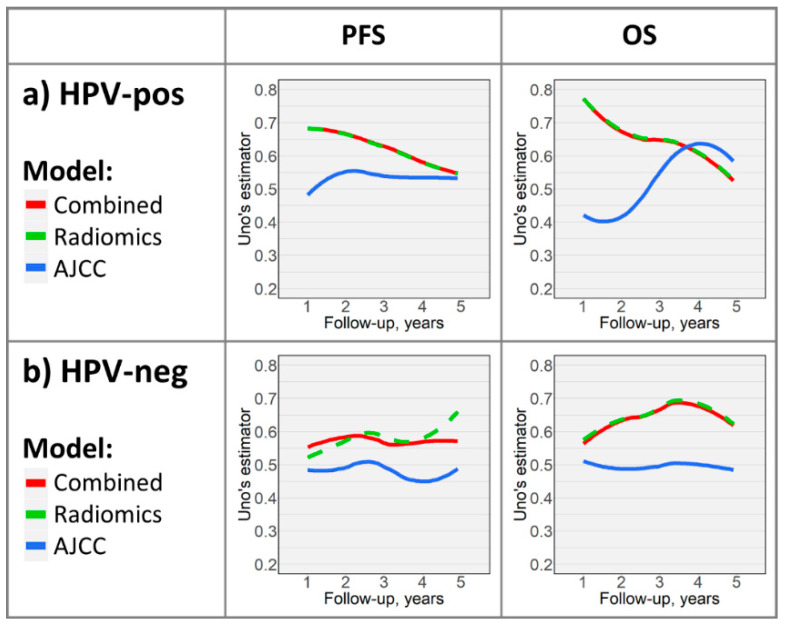
Figure 2.
Time-dependent performance curves depicting select models’ (highlighted in Figure 1) prognostic abilities throughout follow-up in the (a) HPV-associated and (b) HPV-negative cohorts. For comparison, corresponding AJCC models’ curves are depicted.

