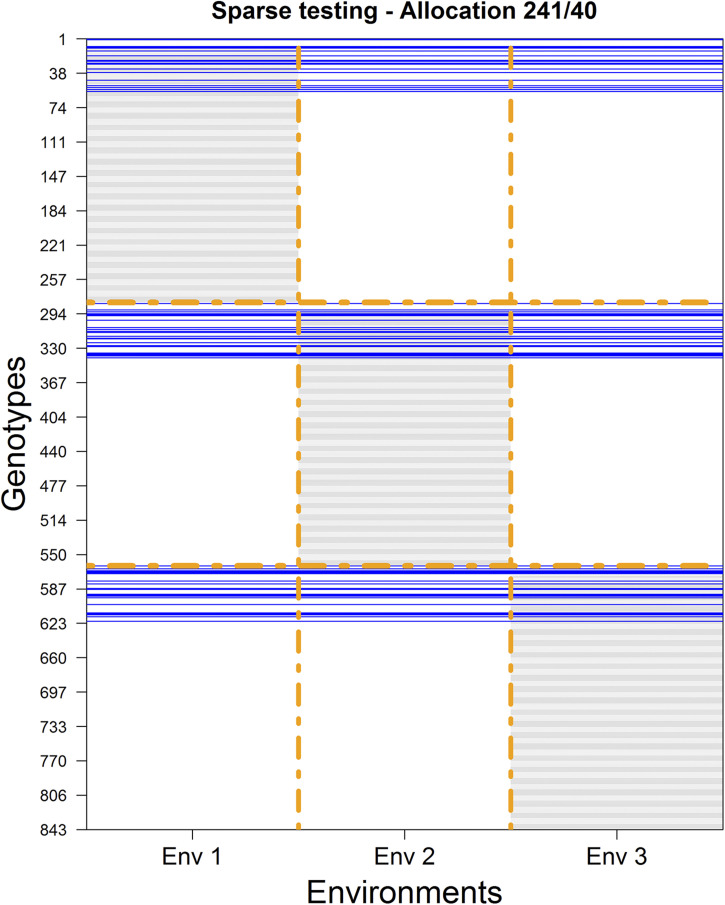
Figure 3.
Experimental design for allocating 843 plots to be tested in three environments for 843-80 = 763 unique genotypes. Horizontal gray lines indicate that these genotypes were tested in the corresponding environments (columns). Blue lines correspond to genotypes (40) tested across environments.

