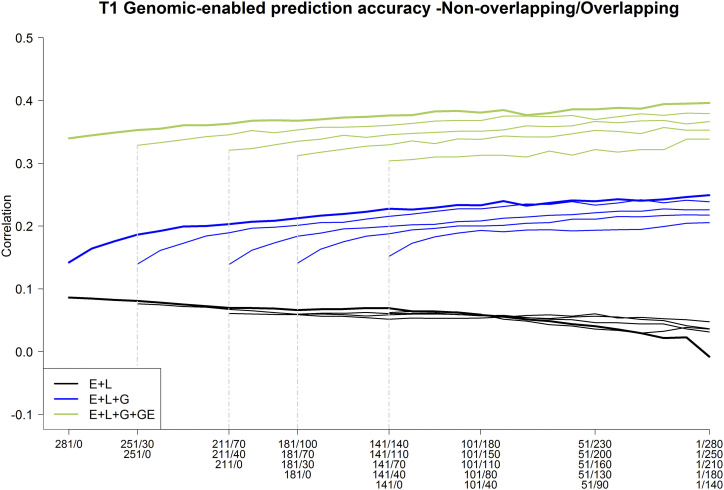
Figure A3.
Maize data set DST1. Average Pearson’s correlation between the observed and predicted values of the maize genotypes for the 3 models M1 (E+L), M2 (E+L+G), and M3 (E+L+G+GE) for different sizes and compositions of the non-overlapped/overlapped allocation designs. Thick lines represent the mean using the largest possible sample size for model calibration (281) for different compositions. The thinner lines represent the mean for the reduced/smaller sample sizes (281-141 in steps of 10).

