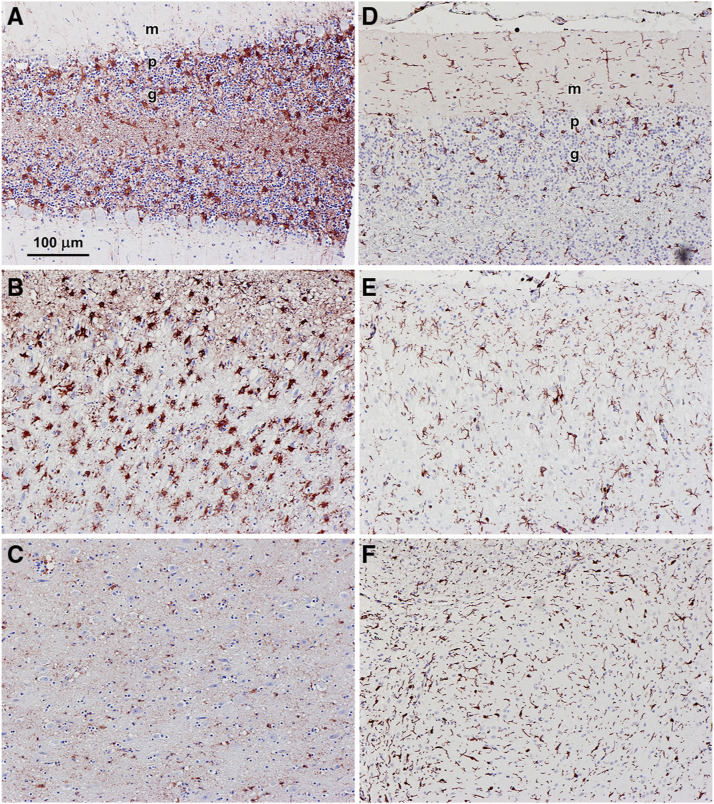
Figure 4.
Light micrographs of sections of cerebellar cortex (A and D), cerebral cortex (B and E), and brainstem (E and F) from the affected cat immunostained for GFAP (A-C) and Iba1 (D-F). GFAP immunostaining demonstrates activated astrocytes and Iba1 immunostaining indicates activated microglia, both of which are indicative of neuroinflammation. Bar in (A) indicates magnification of all 6 micrographs. Layers of the cerebellar cortex indicated in (A) and (D) – m: molecular layer; p:Purkinje cell layer; g: granule cell layer.

