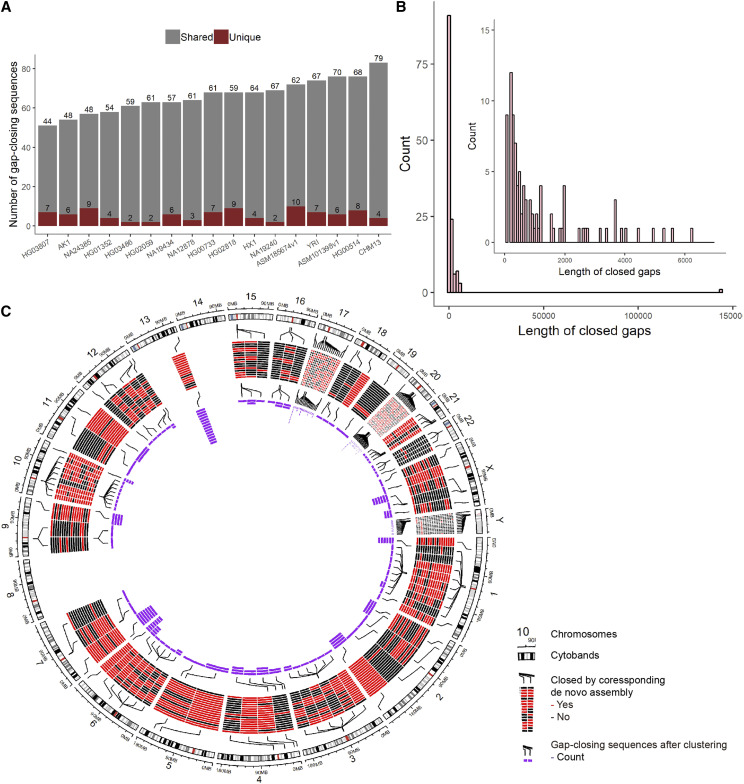
Figure 2.
Discovered gap-closing sequences. (A) Number of the gap-closing sequences in each de novo assembly. Gray bars represent gap-closing sequences also found in other assemblies, red bars represent individual-specific gap-closing sequences. (B) Length distribution of the gaps we closed. As most of gaps were closed by multiple assemblies, the length of gaps is defined as the median length of gap-closing sequences from the different assemblies. (C) A Circos plot showed all gaps we closed and the number of gap-closing sequences before and after clustering. The first track represents GRCh38 and its cytobands. The second track is a heatmap indicating if the gap was closed by one of 17 de novo assemblies and there are connection lines connecting heatmaps and original positions in the genome. The third track represent the number of gap sequences after removal of redundancy.

