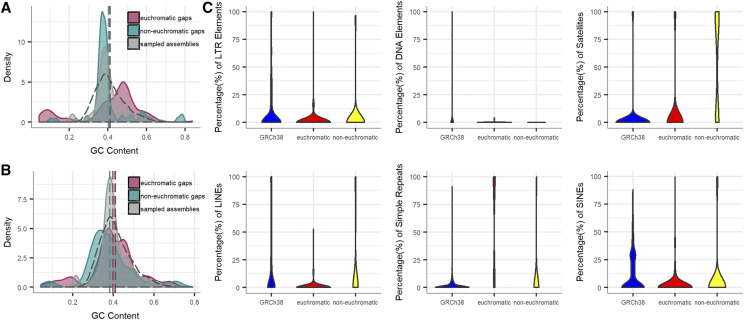
Figure 4.
Characterization of gap-closing sequences. (A) Density plot showing the distribution of GC composition. The mean GC composition of euchromatic gaps, non-euchromatic gaps, and sample-sourced assemblies (dashed vertical lines colored by discovery class), together with sample-sourced reference (black dashed vertical line). (B) Same information as panel A excluding repeats and repeat content annotated by RepeatMasker. (C) Violin plots showing the distribution of LINE, SINE, LTR, simple repeats, DNA elements, and satellite in non-redundant gap-closing sequences, and in randomly sampled sequences from GRCh38.

