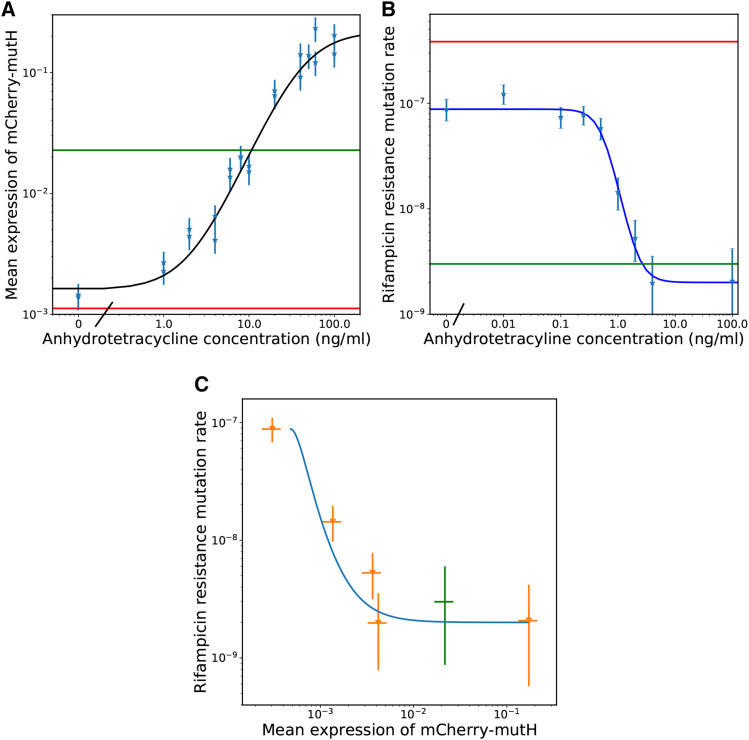
Figure 2.
a Mean mCherry-MutH expression as a function of the concentration of the inducer of mCherry-MutH expression anhydrotetracycline (aTc). The green line is the expression of mCherry-MutH from the wildtype locus which is not sensitive to anhydrotetracycline (aTc). The red line is the level of fluorescence measured from a control strain (ME121) which expresses no mCherry. The light blue points are the mean expression measured by fluorescent imaging. The dark blue curve is a Hill function plus shift fit to that data . The parameters were , , , and b The mutation rate to rifampicin resistance per cell division as a function of the aTc concentration. The red line is the mutation rate of ME121 which is defective for mismatch repair. The green line is the mutation rate of ME120 which has fully functioning mismatch repair. The light blue points are data from NS001 at different levels of aTc induction of mutH expression. mutL induction was saturated with 2000 μM of IPTG. The dark blue curve is a Hill function plus shift fit to that data . The parameters were , , , and c The mutation rate to rifampicin resistance per cell division vs. the expression of mCherry-MutH. The orange data are MutH expression and mutation rates of NS001 grown with varying concentrations of aTc. The green data are the expression of MutH from the wildtype locus and the mutation rate of ME120. The blue curve uses the mean expression of mCherry-MutH from the hill curve fit of expression vs. aTc as x and the mutation rate from the hill curve fit of mutation rate vs. aTc as y.

