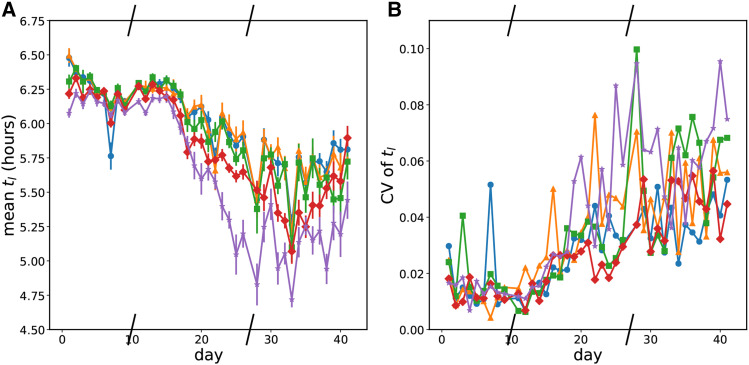
Figure 5.
Evolution of the time before leaving exponential phase growth a The mean time before the optical density exceeded that of exponential phase growth (OD600 = 0.16) by mutation rate condition. Blue circles - Low mutation rate; orange triangles - LoMid mutation rate; green squares - Mid mutation rate; red diamonds - HiMid mutation rate; purple stars - High mutation rate. b The coefficient of variation of the time before the optical desnity exceeded that of exponential phase growth by mutation rate condition. Blue circles - Low mutation rate; orange triangles - LoMid mutation rate; green squares - Mid mutation rate; red diamonds - HiMid mutation rate; purple stars - High mutation rate.

