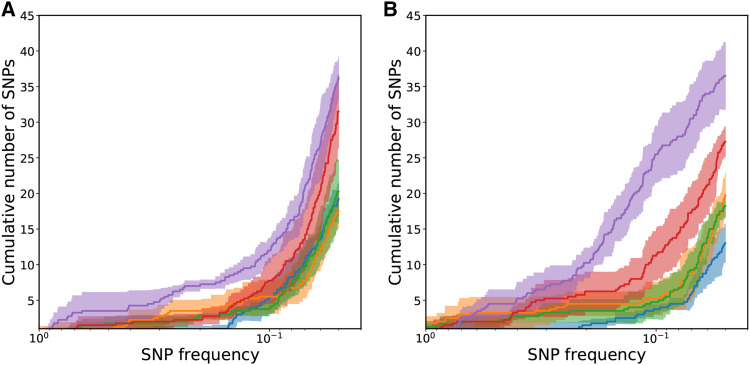
Figure 7.
The mean number of cumulative SNPs for each mutation rate condition. Shading is an estimate of the standard error of the mean for each mutation rate condition. Blue - Low mutation rate; orange - LoMid mutation rate; green - Mid mutation rate; red - HiMid mutation rate; purple - High mutation rate. a is on day 24. b is on day 41.

