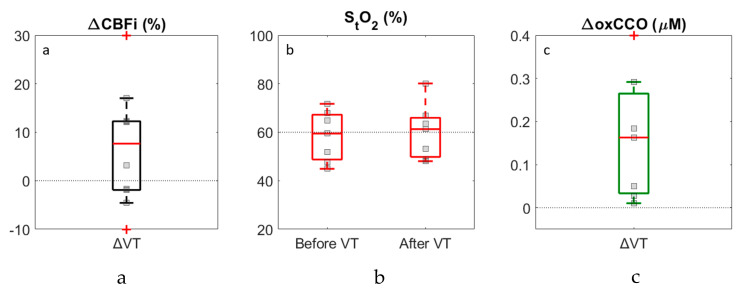
Figure 4.
Boxplots showing changes in CBFi (a) and oxCCO (c) following ventricular tap and StO2 (b) before and after the tap. Results are based on the difference between pre- and post-VT measurements that were averaged over 2-min periods. Individual data points are displayed; outliers are indicated by the crosses on the borders and represent ΔCBFi values of 122% and −25% and ΔoxCCO of 1.7 µM.

