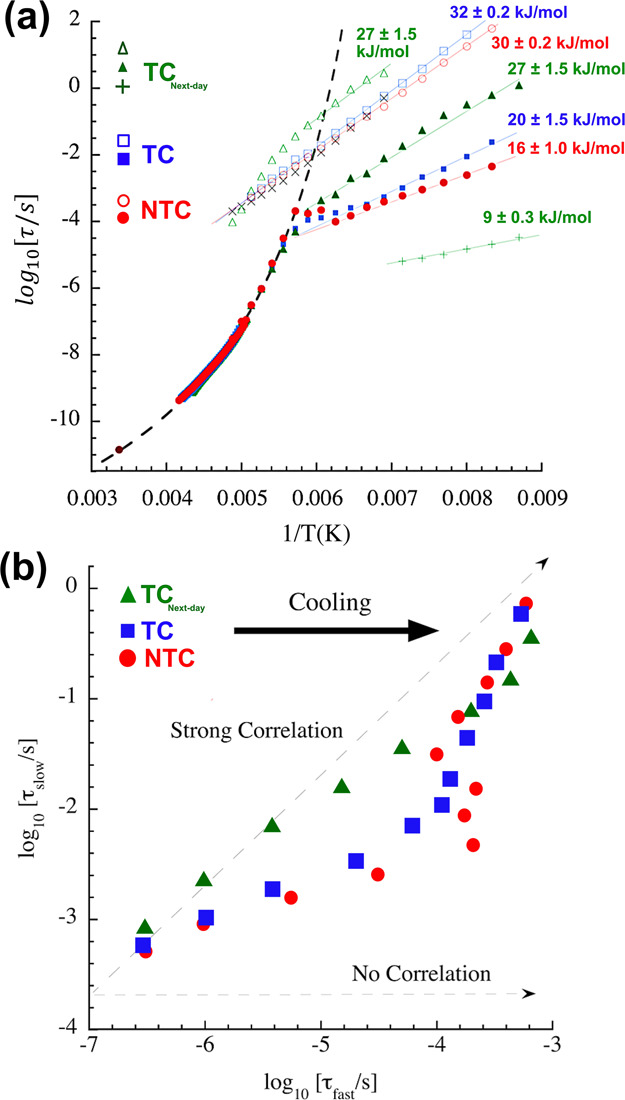
Figure 4.

(a) Arrhenius representation of the characteristic times of the main dielectric relaxation process from the three samples investigated. The solid symbol at 0.0033 K–1 is a superposition of the data collected at room temperature in the microwave frequency range for the three samples. The dashed line corresponds to a VFT description, whereas solid lines show Arrhenius behaviors. The “x” symbols close to the slow relaxations from the NTC and TC depict the data from the dielectric relaxation of bulk water (ice) included for comparison purposes. (b) Correlation plot showing the log10(τslow) versus log10(τfast) for NTC, TC, and TCnext-day. The “strong correlation” line depicts a slope = 1 and is a reference for a proportional relation between the fast and slow processes represented in (a).
