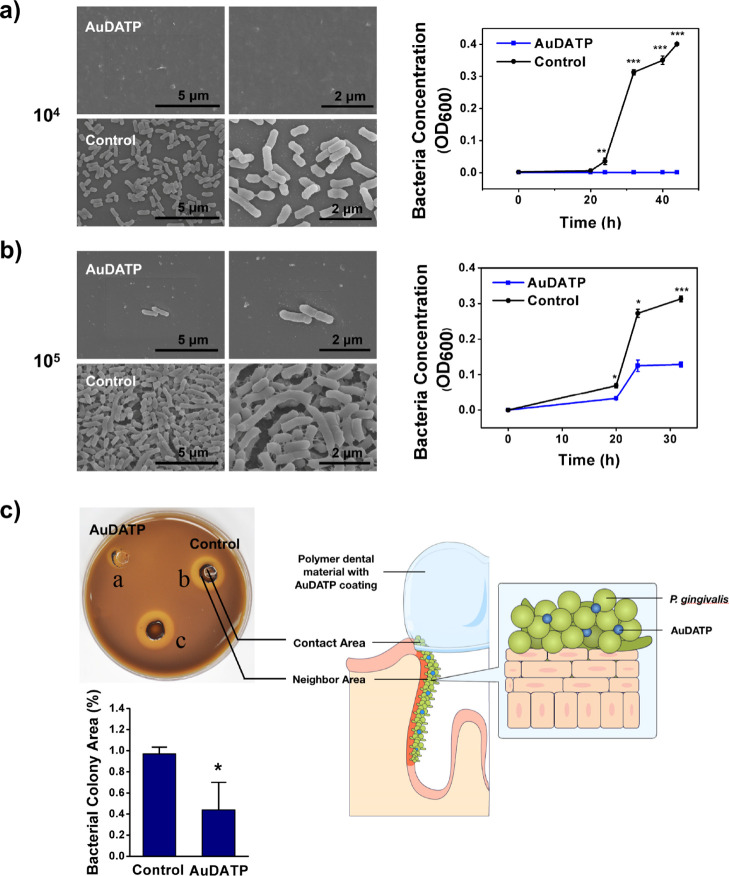
Figure 2.
(a,b) SEM images of bacterial cells accumulated on the sample surface when immersed into bacterial suspension and curves of optical density at 600 nm of bacterial suspension with the tested sample [(a) density of bacterial suspension: 104 CFU/mL, (b) density of bacterial suspension: 105 CFU/mL, n = 3 in each group, data in graphs is the average of multiple experiments; magnification: 10.0k× and 20.0k×; voltage: 5.0 kV]. (c) Contact assay: comparison of bacteria growth area ratio of the AuDAPT-coated samples and untreated samples [(a) AuDAPT-coated sample contacting area; (b) untreated sample contacting area; (c) blank control; control: (b/c); AuDAPT: (a/c), n = 3, data in graphs is the average of multiple experiments] (P < 0.05).

