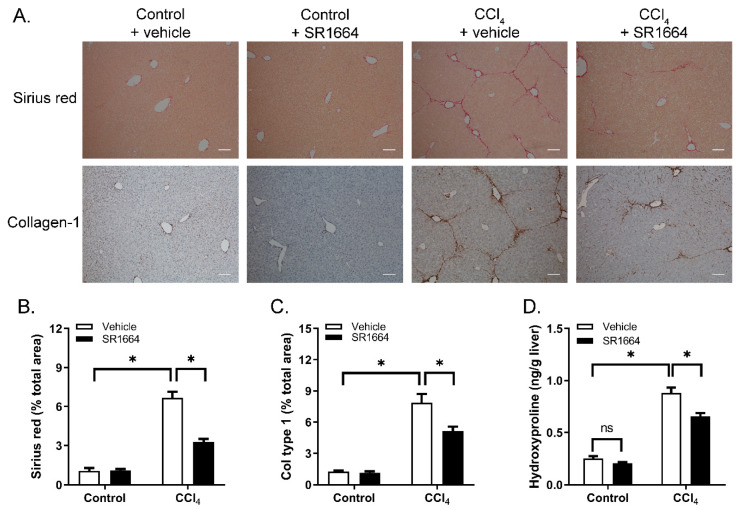
Figure 2.
Collagen deposition in liver from control or fibrotic mice treated with SR1664 or vehicle. (A) Sirius red stain of total collagen (top panel) or immunohistochemistry for type 1 collagen (bottom panel); bar = 200 µm. (B) Quantification of Sirius red staining intensity.(C) Quantification of type 1 collagen staining. (D) Liver tissue hydroxyproline content. Mean ± S.E.M.; n = 6; * p < 0.05 by ANOVA; ns: not significant.

