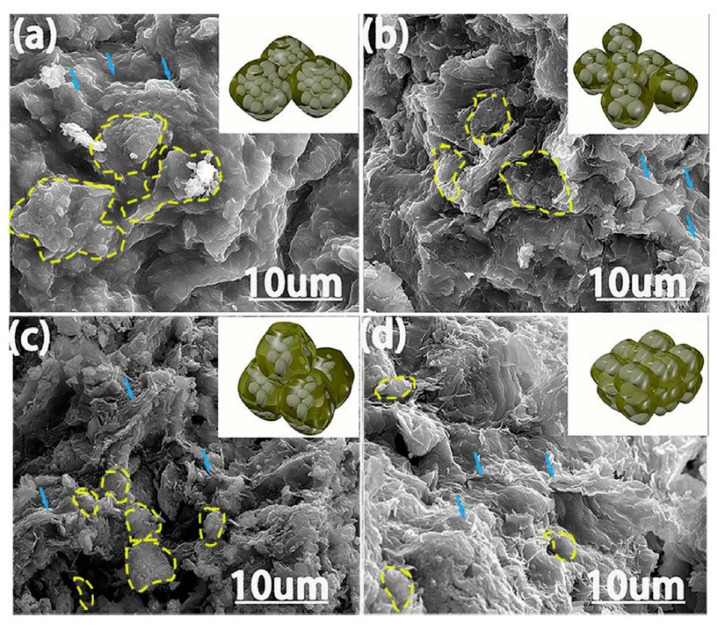
Figure 22.
SEM images of hydrated geopolymer particles encapsulated by graphene oxides sheets (a–d), and their models. With the increase of GO concentration from 4 wt% to 20 wt% in nanocomposites, the agglomerate size (showed by dotted-line circles) decrease. Reproduced from [209], with permission from Elsevier, 2017.

