Figure 3.
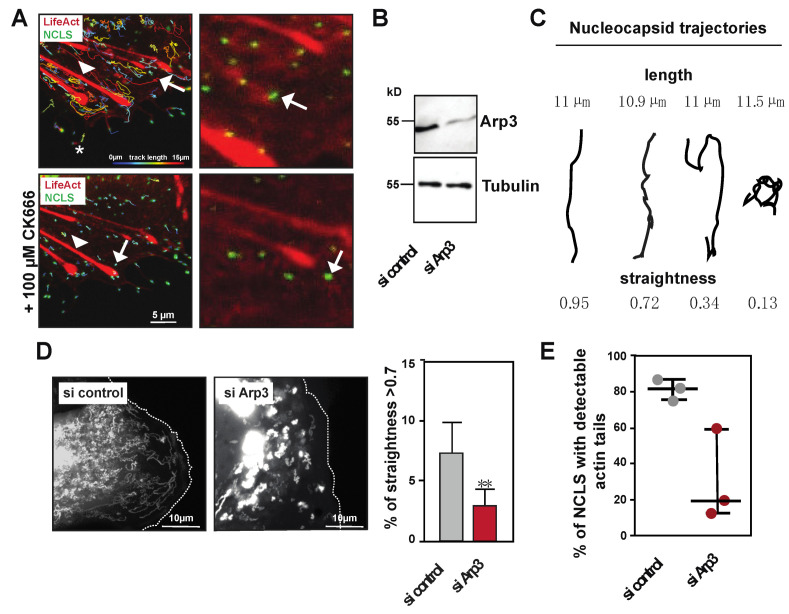
NCLS induction of actin tails depends on Arp2/3 activity. (A) Huh7 cells transfected with NP, VP24 and VP35 and LifeAct-CLIP were monitored over time. The left panels show an overlay image of the tracks as calculated by Imaris (color coded for length) and LifeAct-CLIP (still image from movie). Note, CK666 incubation does not interfere with filopodia (asterisk) or stress fibers (arrow head) (see Movie S2). The zoomed image (right panels) show still images of the movie, revealing that CK666 treatment abolishes actin tail formation (white arrows). (B) Western Blot showing the depletion of Arp3 after siRNA treatment. (C) Cartoon showing different movements of trajectories and their corresponding straightness value. (D) Left panel shows maximum intensity projections of time lapse imaging of Huh7 cells transfected either with control or Arp3 siRNA. The right panel shows the graphical analysis of live cell imaging comparing all tracks > 10 µm in cells transfected either with control or Arp3 siRNA. Note, the relative amount of tracks with a straightness > 0.7, representing directed long-distance transport, is reduced in cells transfected with Arp3 siRNA (taken from n = 3 experiments, * p = 0.0027, Mann–Whitney Test). (E) Graph shows the percentage of trajectories with pulsative actin tails in live cell imaging (n = 3, error bars indicate mean with standard deviation).

