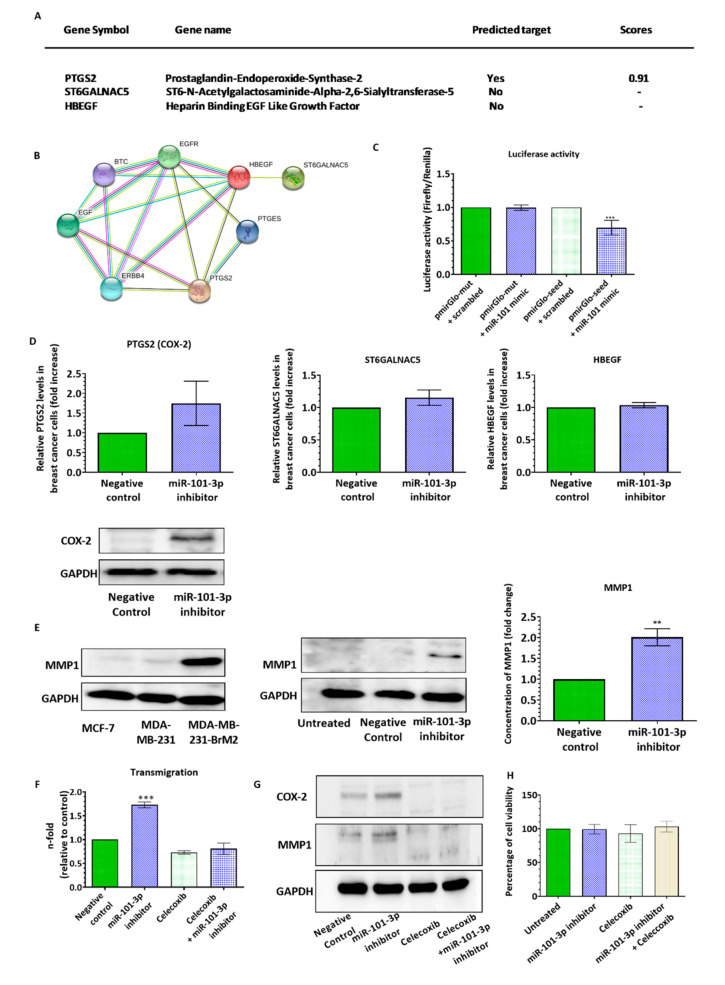
Figure 3.
Ectopic downregulation of miR-101-3p in breast cancer cells promotes trans-endothelial migration through induction of COX-2-MMP1 expression. (A) List of has-miR-101-3p transendothelial migration-related predicted target genes in silico. (B) Protein–protein interaction network analysis retrieved from STRING (http://www.string-db.org/, version 9.1) showing the link between the different molecules involved in transmigration of breast cancer cells across the blood–brain barrier (BBB) (HBEGF, PTGS2 and ST6GALNAC5). Different colors of the lines represent the types of evidence for association: green line, neighborhood evidence; red line, fusion evidence; purple line, experimental evidence; light blue line, database evidence; black line, coexpression evidence; blue line, co-occurrence evidence; and yellow line, text-mining evidence. (C) Relative luciferase activity expressed as Firefly/Renilla luciferase activity. (D) Relative PTGS2 (COX2), ST6GALNAC5 and HBEGF mRNA and protein expression measured by real time PCR and western blot in control and anti-miR-101-3p transfected cells. (E) Western Blot analysis of MMP1 in the different BC cell lines and in control and anti-miR-101-3p transfected MDA-MB-231-TGL cells. MMP-1 levels released in the culture media were quantified by ELISA. (F) The transmigration ability of MDA-MB-231-TGL cells treated with miR-101-3p inhibitor and/or celecoxib was examined by trans-endothelial migration assay. (G) Western Blot analysis of COX-2 and MMP1 in MDA-MB-231-TGL cells treated with miR-101-3p inhibitor and/or celecoxib. (H) Cell viability of MDA-MB-231-TGL cells treated with miR-101-3p inhibitor and/or celecoxib was measured by MTT assay. Data are mean ±SD from three independent experiments. ** p < 0.01, *** p < 0.001.

