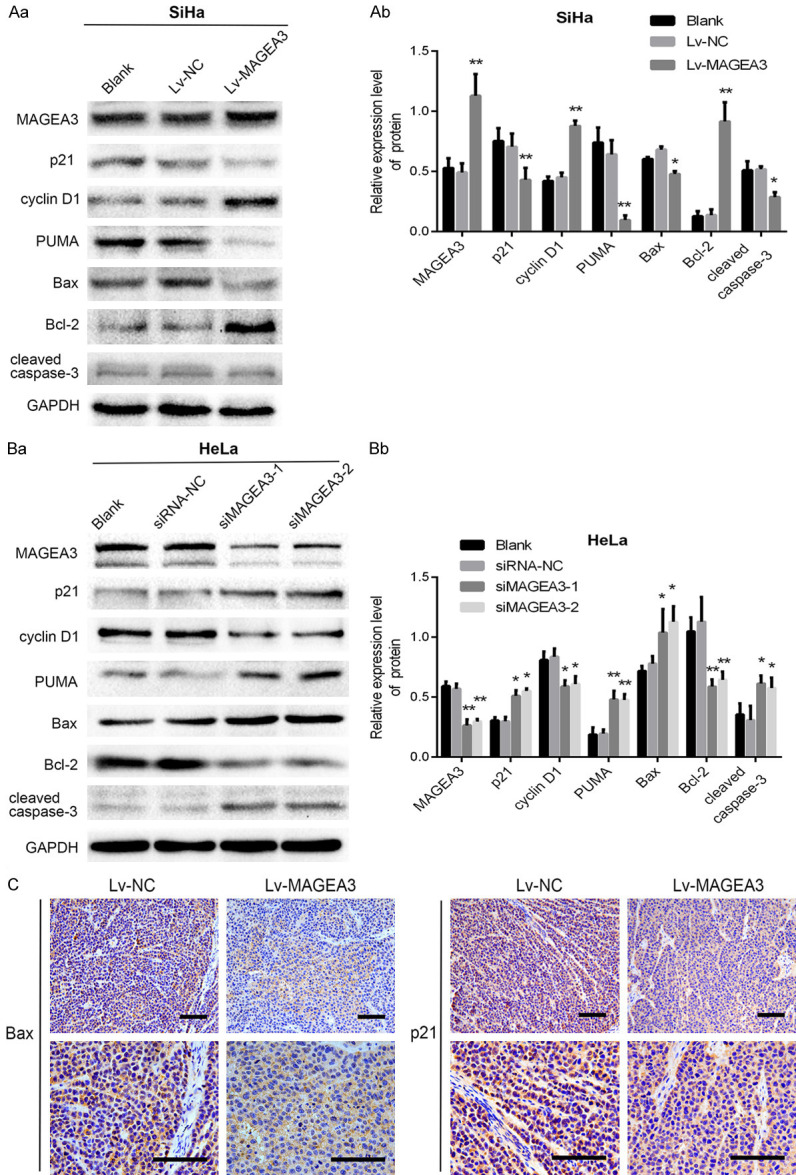
Figure 5.

Effects of MAGEA3 expression on the protein levels of p53 downstream targets. A, B. Western blotting analysis of p53, p21, Bax, Bcl2, PUMA, cyclin D1, and cleaved caspase-3 proteins following overexpression or knockdown of MAGEA3 in SiHa (Aa, Ab) and HeLa (Ba, Bb) cells. *P<0.05, **P<0.01 vs. control groups. C. Immunohistochemical analysis of p21 and Bax expression in the Lv-MAGEA3 group and Lv-NC group of xenograft tumors. Bar length: 100 µm.
