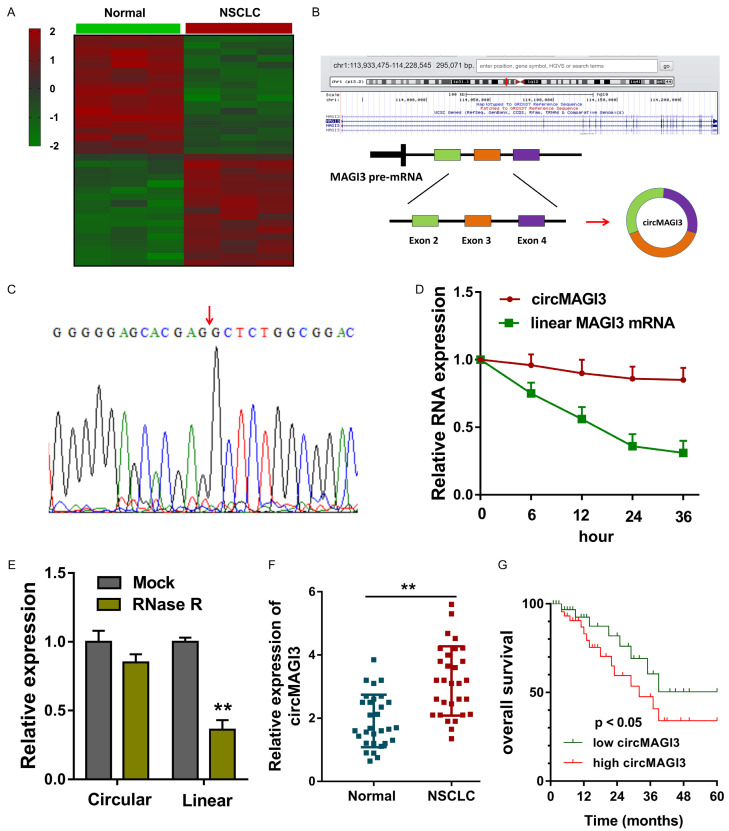
Figure 1.
Microarray revealed the high-expression of circMAGI3 in NSCLC tissue. A. Heat map illustrated the circRNA microarray analysis for the circRNA profile in NSCLC tissue. B. Schematic diagram revealed that circMAGI3 (hsa_circ_0110498) was generated from the MAGI3 exons. C. Sanger sequence analysis found the conjunction sites for circMAGI3. D. RT-PCR indicated the expression of circular transcript of circMAGI3 and linear transcript of MAGI3 mRNA when administrated with Actinomycin D. E. RT-PCR indicated the expression of circular transcript of circMAGI3 and linear transcript of MAGI3 mRNA when administrated with RNase R. F. CircMAGI3 expression in NSCLC tissue as comparing to the normal samples. G. Survival rate analysis using Log-rank test revealed the survival rate for NSCLC with circMAGI3 level. **P < 0.01, data represent the means ± SD.

