Figure 2.
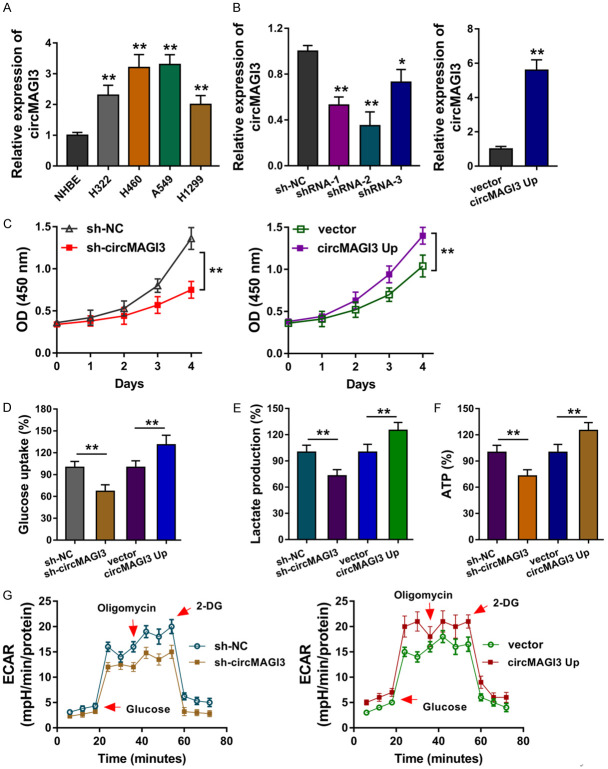
CircMAGI3 promoted the glycolysis and proliferation of NSCLC. (A) RT-PCR showed the circMAGI3 level in NSCLC cells and normal cells. (B) The over-expression and knockdown of circMAGI3 were respectively constructed using A549 cells for the gain- or loss-of-functional experiments. (C) CCK-8 assay showed the proliferative ability of A549 cells transfected with circMAGI3 over-expression and knockdown. (D) Glucose uptake analysis and (E) lactate production analysis and (F) ATP analysis revealed the glucose uptake level, lactate production level and ATP capacity. (G) Extracellular acidification rate (ECAR) analysis showed the glycolytic capacity of NSCLC cells. *P < 0.05, **P < 0.01, data represent the means ± SD.

