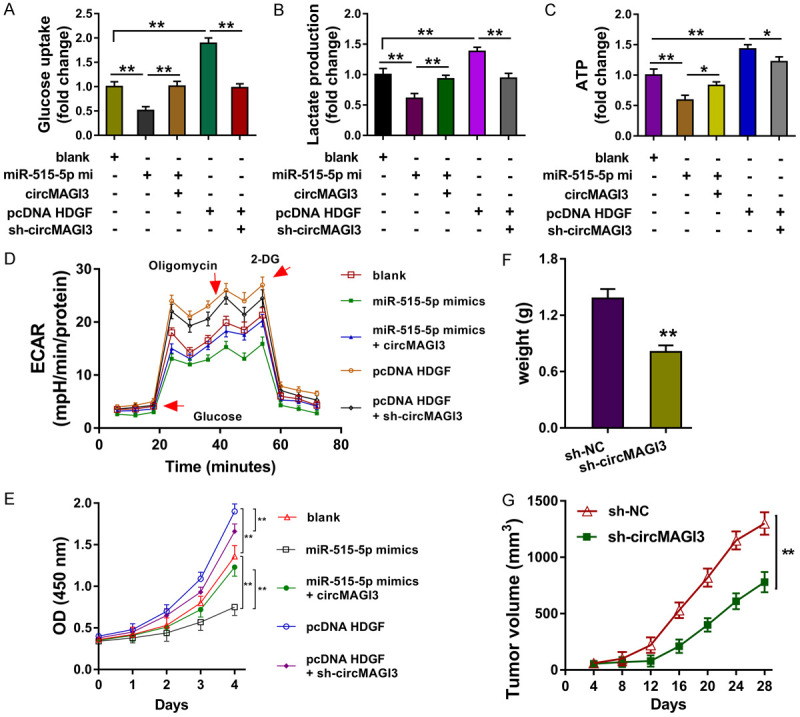
Figure 4.

CircMAGI3/miR-515-5p/HDGF axis regulated the glycolysis and proliferation of NSSCLC cells. (A) Glucose uptake analysis revealed the glucose uptake level in A549 cells transfected with miR-515-5p mimics, circMAGI3 overexpression, HDGF overexpression and circMAGI3 knockdown. (B) Lactate production analysis revealed the lactate level. (C) ATP analysis revealed the ATP level. (D) ECAR analysis revealed the glycolytic capacity. (E) CCK-8 revealed the proliferation. (F) The tumor volume and (G) weight of NSCLC neoplasm in mice injected with A549 cells. *P < 0.05, **P < 0.01, data represent the means ± SD.
