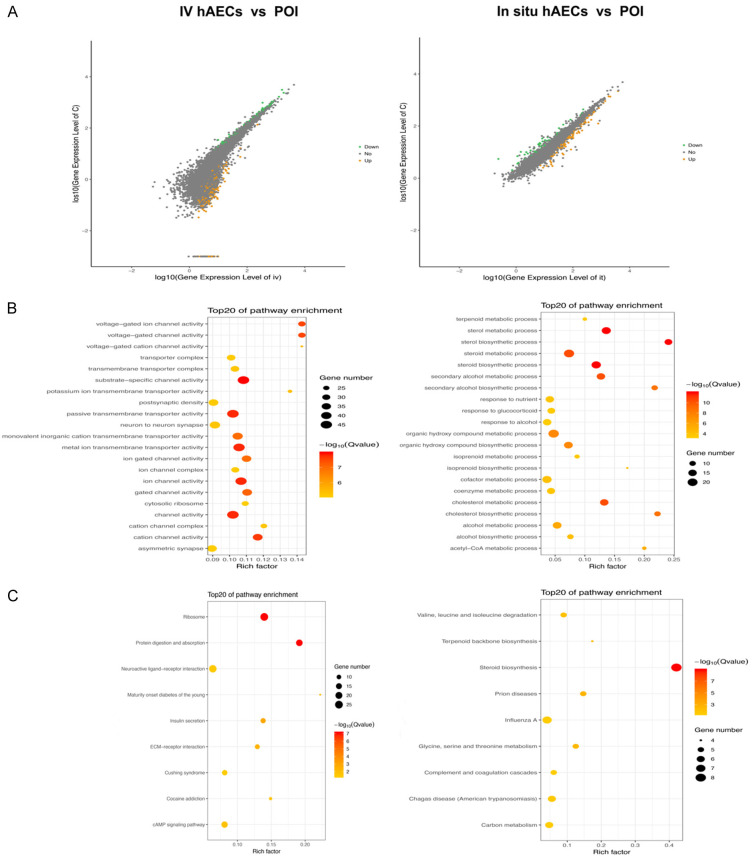
Figure 8.
mRNA sequencing results. (A) scatter plots show DEGs between the IV hAEC and POI groups and the in situ hAEC vs POI groups. Yellow plots indicate upregulated DEGs, green plots represent downregulated DEGs and gray plots suggest no significantly changed genes. DEGs were calculated by |log2 fold change| ≥1 and adjusted p<0.05 by comparing the FPKM values. (B, C) GO (B) and KEGG (C) analysis of DEGs were performed. Corrected p<0.05. DEGs, differentially expressed genes; GO, gene ontology; IV hAEC, intravenous human amniotic epithelial cell; KEGG, Kyoto encyclopedia of genes and genomes; POI, primary ovarian insufficiency.

