
Figure 10.
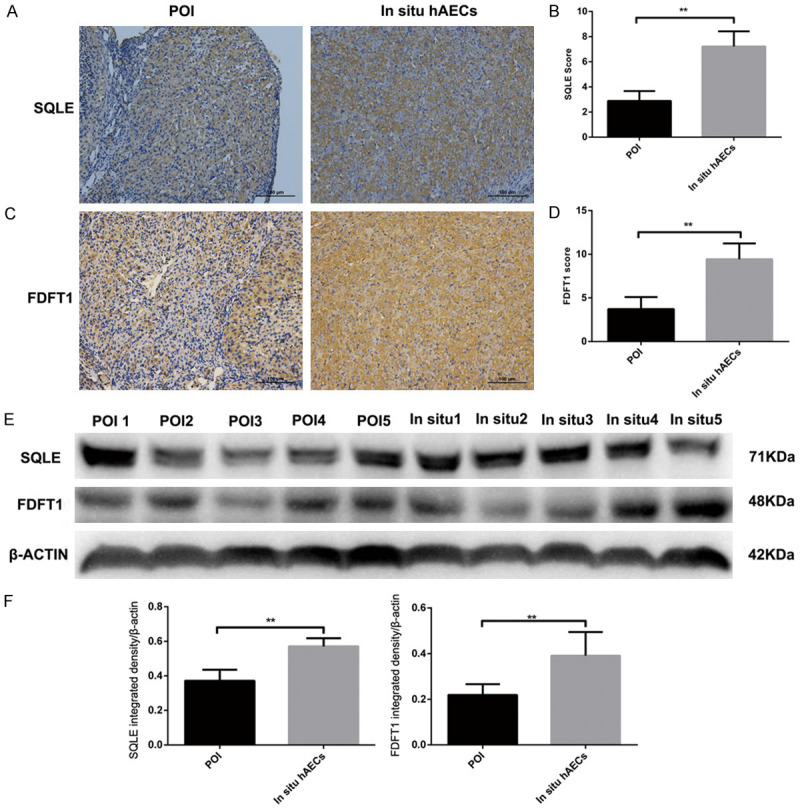
SQLE and FDFT1 expression by immunohistochemical staining and Western blotting analysis. (A-D) SQLE (A, B) and FDFT1 (C, D) expression are upregulated in the in situ hAEC group compared with the POI group by immunohistochemical analysis. (E, F) SQLE and FDFT1 were determined by Western blotting. The same trend as in the immunohistochemical analysis result was observed. **P<0.01. FDFT1, farnesyl-diphosphate farnesyltransferase 1; SQLE, squalene monooxygenase.