Figure 1.
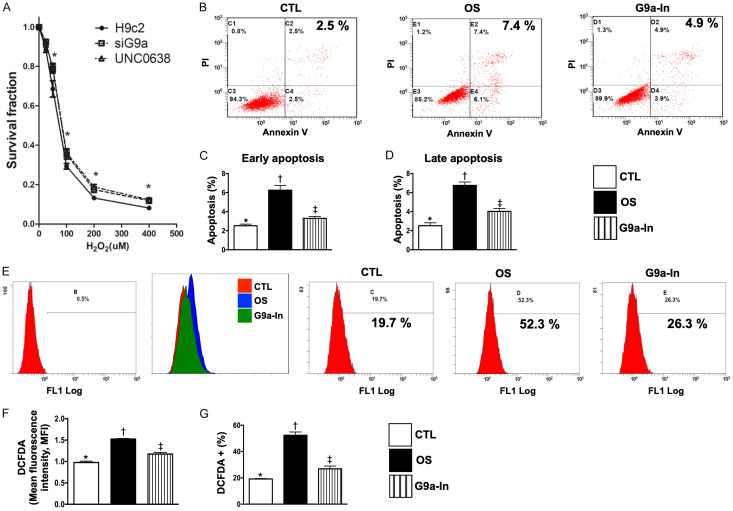
Protective effects of G9a inhibitor and si-G9a on survival rate of H9C2 cells undergoing the H2O2 treatment, and flow cytometric analysis for clarifying the therapeutic impact of G9a inhibitor on protecting H9C2 cells against H2O2-indcued apoptosis and oxidative stress. A. Illustrating the survival rate of H9C2 underwent the stepwise-increased H2O2 concentration. The results showed that si-G9a (i.e., siG9a) and UNC0638 (G9a inhibitor, G9a-In) therapy significantly improved the H9C2 survival rate, * vs. H9c2 only, P<0.005. B. Illustrating annexin-V/PI analysis by flow cytometry of H9C2 cells treated with 100 µM H2O2 for 4 h and pretreated with 1.0 μM G9a inhibitor for 3 h. Analytical results of H9C2 apoptosis: C. For early apoptosis: * vs. other groups with different symbols (†, ‡), P<0.0001; D. For late apoptosis * vs. other groups with different symbols (†, ‡), P<0.0001. E. Illustrating oxidative stress fluorescent intensity (i.e., stained by DCFDA) by flow cytometry of H9C2 cells treated with 100 µM H2O2 for 4 h and pretreated with 1.0 μM G9a inhibitor for 3 h. Analytical results of fluorescent intensity: F. Expression of mean fluorescent intensity (MIF), * vs. other groups with different symbols (†, ‡), P<0.001; G. Expression of DCFDA (%), * vs. other groups with different symbols (†, ‡), P<0.0001. DCFDA = Cell-free 2’,7’-dichloroflurescin diacetate. All statistical analyses were performed by one-way ANOVA, followed by Bonferroni multiple comparison post hoc test (n=4 for each group). Symbols (*, †, ‡) indicate significance (at 0.05 level). CTL = control group; OS = oxidative stress; G9a-In = G9a inhibitor (i.e., UNCO638).

