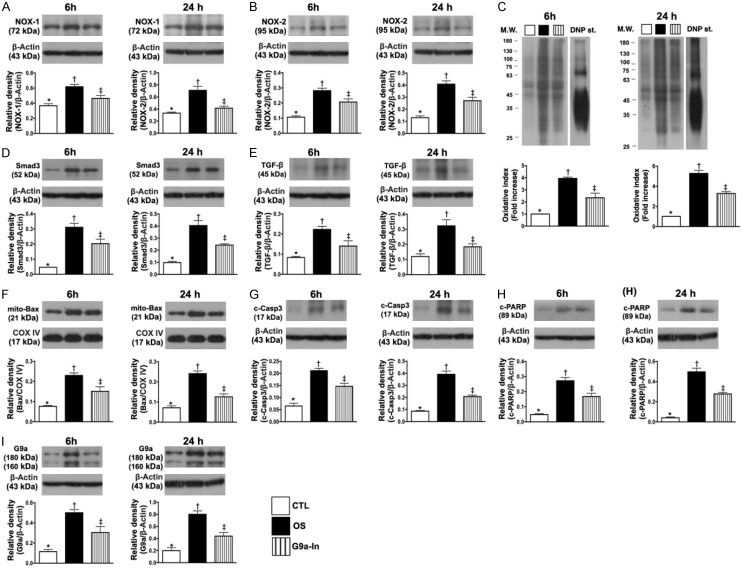
Figure 2.
In vitro study to verify the therapeutic impact of G9a inhibitor (UNC0638) on inhibiting the H2O2-induced oxidative stress, apoptosis and fibrosis of H9C2 cells. A. Protein expression of NOX-1, at 6 h: * vs. other groups with different symbols (†, ‡), P<0.005; at 24 h: * vs. other groups with different symbols (†, ‡), P<0.001. B. Protein expression of NOX-2, at 6 h: * vs. other groups with different symbols (†, ‡), P<0.001; at 24 h: * vs. other groups with different symbols (†, ‡), P<0.001. C. Oxidized protein expression, at 6 h: *vs. other groups with different symbols (†, ‡), P<0.0001; at 24 h, *vs. other groups with different symbols (†, ‡), P<0.0001. (Note: left and right lines shown on the upper panel represent protein molecular weight marker and control oxidized molecular protein standard, respectively). M.W. = molecular weight; DNP = 1-3 dinitrophenylhydrazone. D. Protein expression of Smad3, at 6 h: * vs. other groups with different symbols (†, ‡), P<0.0001; at 24 h: * vs. other groups with different symbols (†, ‡), P<0.0001. E. Protein expression of transforming growth factor (TGF)-ß, at 6 h: * vs. other groups with different symbols (†, ‡), P<0.005; at 24 h: * vs. other groups with different symbols (†, ‡), P<0.005. F. Protein expression of mitochondrial (Mito)-Bax, at 6 h: * vs. other groups with different symbols (†, ‡), P<0.001; at 24 h: * vs. other groups with different symbols (†, ‡), P<0.0001. G. Protein expression of cleaved caspase 3 (c-Csp-3), at 6 h: * vs. other groups with different symbols (†, ‡), P<0.001; at 24 h: * vs. other groups with different symbols (†, ‡), P<0.0001. H. Protein expression of c-PARP, at 6 h: * vs. other groups with different symbols (†, ‡), P<0.0001; at 24 h: * vs. other groups with different symbols (†, ‡), P<0.0001. I. Protein expression of G9a, at 6 h, * vs. other groups with different symbols (†, ‡), P<0.005; at 24 h: * vs. other groups with different symbols (†, ‡), P<0.001. (n=4 for each group). CTL = control group; OS = oxidative stress; G9a-In = G9a inhibitor.

