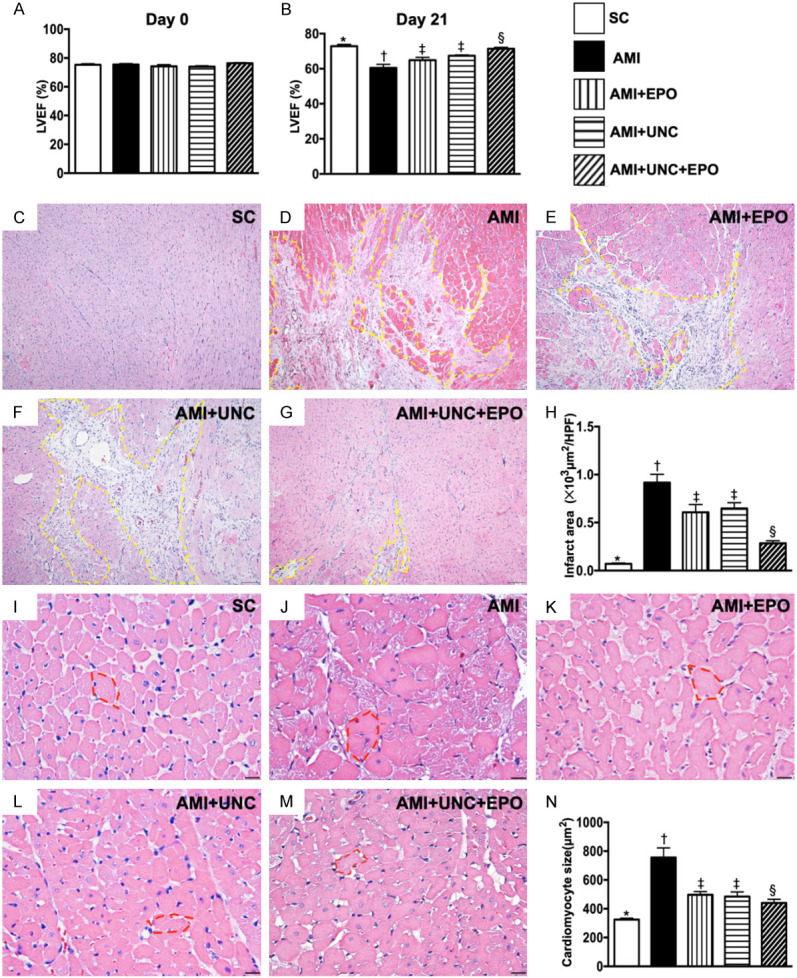
Figure 4.

The LVEF and infarct area by day 21 after AMI induction. A. The baseline left ventricular ejection fraction (LVEF), P>0.5. B. The LVEF at day 21, * vs. other groups with different symbols (†, ‡, §), P<0.001. C-G. H.E. stain microscopic finding (100 ×) for identification of LV infarction area (yellow dotted line). H. Analytical result of infarct area, * vs. other groups with different symbols (†, ‡, §), P<0.0001. Scale bars in right lower corner represent 100 µm. I-M. Illustrating the H.E., stain of microscopic finding (400 ×) for identification of cardiomyocyte size (red circle). N. Analytical result of cardiomyocyte size, * vs. other groups with different symbols (†, ‡, §), P<0.0001. Scale bars in right lower corner represent 20 µm. (n=6 for each group). SC = sham-operated control; AMI = acute myocardial infarction; EPO = erythropoietin; UNC = UNC0638, a G9a inhibitor.
