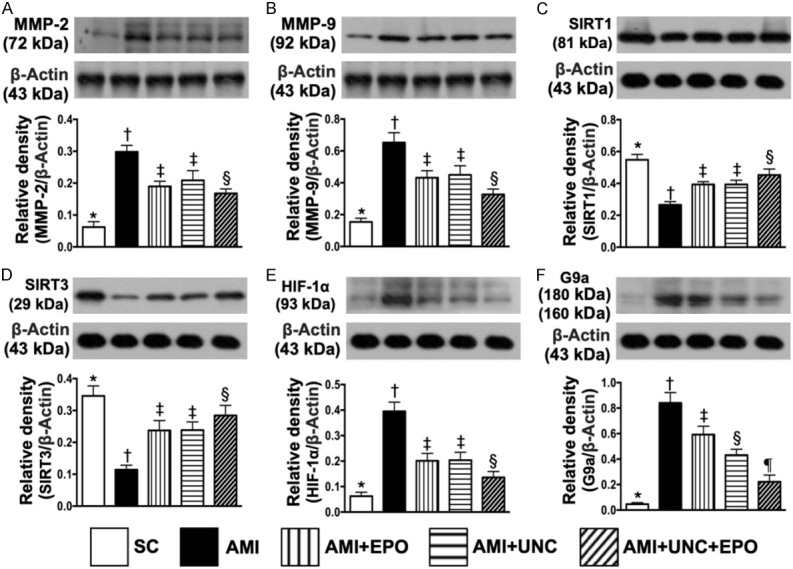
Figure 8.

Protein expressions of inflammatory, anti-oxidative-stress, anti-ischemic biomarkers and G9a by day 21 after AMI induction. A. Protein expression of matrix metalloproteinase (MMP)-2, * vs. other groups with different symbols (†, ‡, §), P<0.0001. B. Protein expression of MMP-9, * vs. other groups with different symbols (†, ‡, §), P<0.0001. C. Protein expression of SIRT1, * vs. other groups with different symbols (†, ‡, §), P<0.001. D. Protein expression of SIRT3, * vs. other groups with different symbols (†, ‡, §), P<0.001. E. Protein expression of hypoxia induced factor (HIF)-1α, * vs. other groups with different symbols (†, ‡, §), P<0.0001. F. Protein expression of G9a, * vs. other groups with different symbols (†, ‡, §, ¶), P<0.0001. (n=6 for each group). SC = sham-operated control; AMI = acute myocardial infarction; EPO = erythropoietin; UNC = UNC0638, a G9a inhibitor.
