
Figure 2.
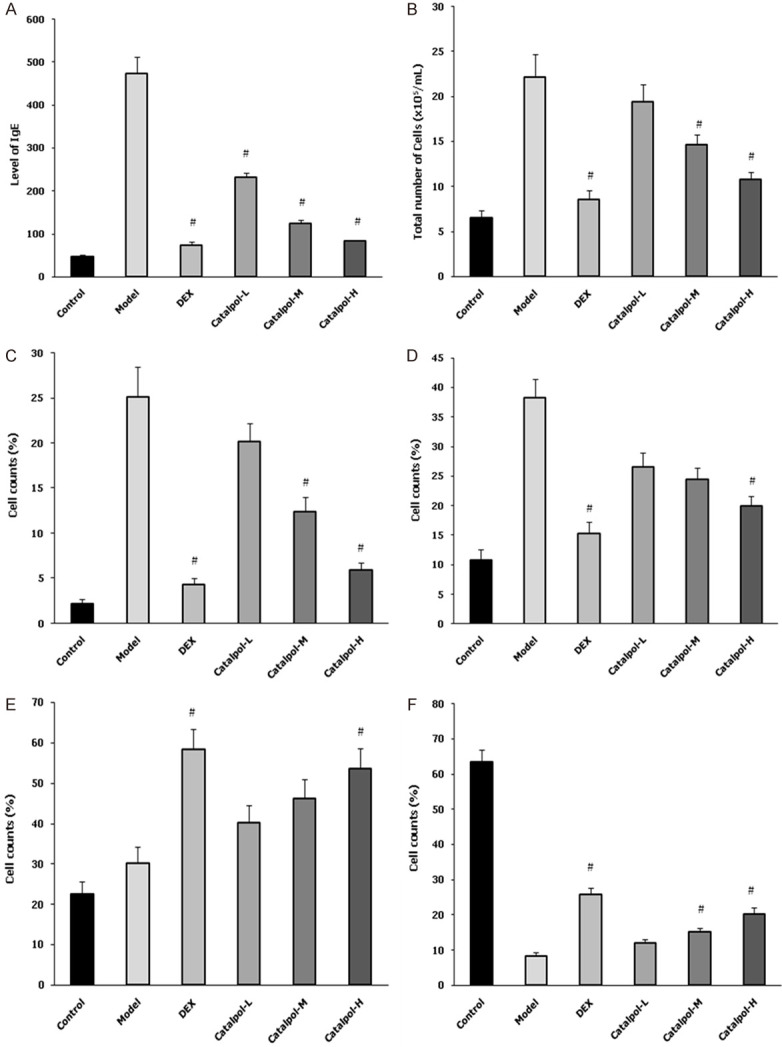
The level of IgE in BALF (A), total number of cells in BALF (B), and percentages of eosinophils (C), neutrophils (D), lymphocytes (E), and macrophages (F) in BALF for the experimental groups. “#” represents P<0.05 comparing the model group. Data are presented as the mean ± SD.