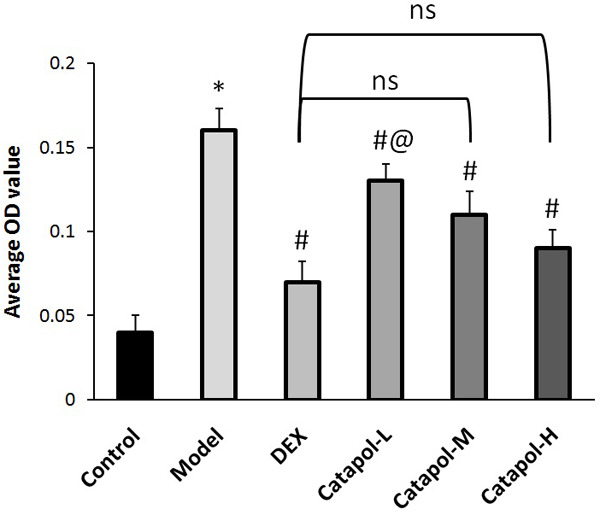
Figure 4.

The average OD values for EGF expression. “*” represents P<0.05 comparing the control group, “#” represents P<0.05 comparing the model group, “@” represents P<0.05 comparing the DEX group, “ns” represents no significant difference. Data are presented as the mean ± SD.
