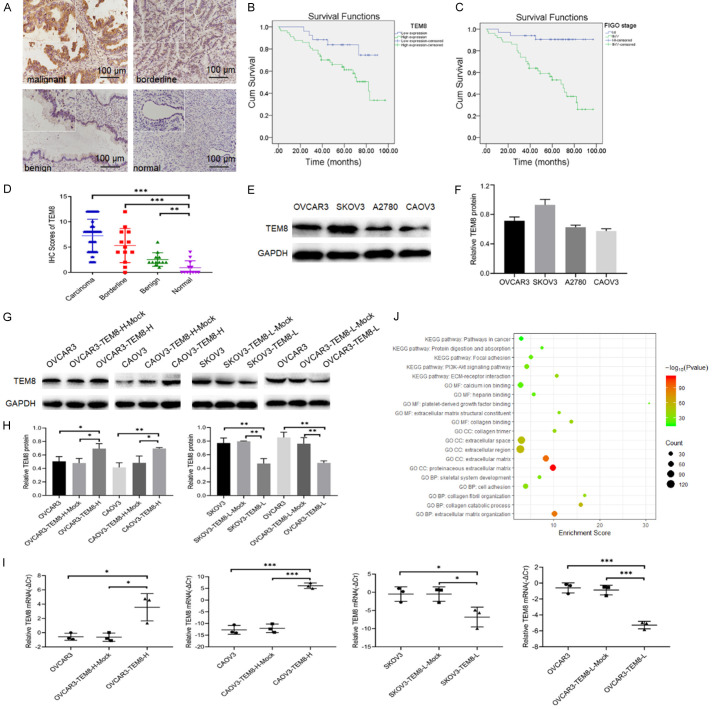
Figure 1.
High TEM8 expression correlates with poor prognosis of EOC patients and its function prediction using DAVID: (A) TEM8 expression in various ovarian tissues (×200, scale bar = 100 μm; upper left ×400): malignant ovarian epithelial tumors (n = 103), borderline epithelial ovarian tumors (n = 13), benign ovarian epithelial tumors (n = 12), normal ovarian tissues (n = 12). (B, C) Influence of TEM8 expression and FIGO stage on the overall survival of ovarian cancer patients. (D) Immunostaining score of TEM8 in malignant, borderline, benign, and normal ovarian tissues. (E, F) Representative images and quantitation of the western blot showed that the protein expression of TEM8 in four OC cell lines (n = 3). GAPDH was used as an internal control. (G, H) Representative images and quantitation of the western blot showed that the protein expression of TEM8 in the TEM8 overexpression/knockdown groups (n = 3). GAPDH was used as an internal control. (I) The relative TEM8 mRNA expression in the TEM8 overexpression/knockdown groups (n = 3). (J) The bubble plot showed top5 GO (BP/CC/MF) and KEGG pathway of coexpressed genes of TEM8. Data are presented as mean ± SD. *, P < 0.05; **, P < 0.01; ***, P < 0.001.

