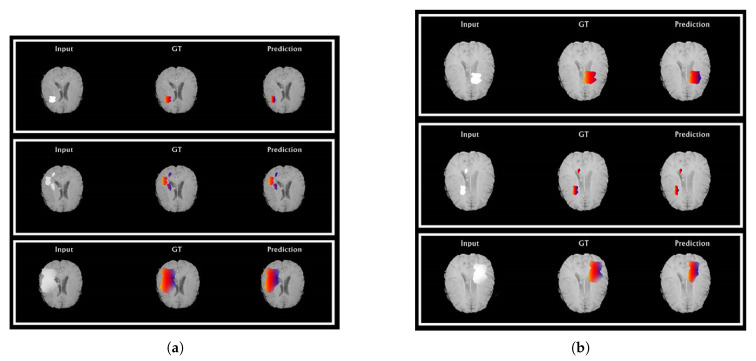
Figure 6.
Automatic segmentation results of HGG (a) and LGG (b) cases. Red: edema, blue: non-enhancing tumor. From left to right: (i) original image, (ii) ground truth, and (iii) demonstration of automatic segmentation results from the proposed method. (a) The segmentation results of HGG cases compared to their ground truth and (b) the segmentation results of LGG cases compared to their ground truth.

