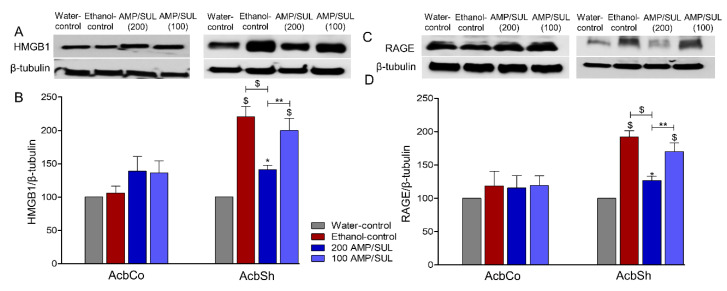
Figure 4.
Effects of AMP/SUL treatments (100 mg/kg and 200 mg/kg, i.p.) for five days on the expression of HMGB1 in the AcbCo and AcbSh. (A) Immunoblot of HMGB1 and β-tubulin in the AcbCo and AcbSh. (B) Quantitative analysis using one-way ANOVA followed by Newman-Keuls test indicated that there were no significant differences in the expression of HMGB1 among the water-control, ethanol-control, ethanol-AMP/SUL (100 mg/kg), and ethanol-AMP/SUL (200 mg/kg) groups in the AcbCo. Quantitative analysis using one-way ANOVA followed by Newman-Keuls test indicated that there was a significant increase in HMGB1 expression in the ethanol-control group compared to water-control group, while post-treatment with AMP/SUL (200 mg/kg, but not 100 mg/kg) for five days normalized HMGB1 expression in the AcbSh. Ethanol-AMP/SUL (100 and 200 mg/kg) groups had higher HMGB1 expression compared to water-control group. (C) Immunoblot of RAGE and β-tubulin in the AcbCo and AcbSh. (D) Quantitative analysis using one-way ANOVA followed by Newman-Keuls test indicated that there were no significant differences in the expression of RAGE among the water-control, ethanol-control, ethanol-AMP/SUL (100 mg/kg), and ethanol-AMP/SUL (200 mg/kg) groups in the AcbCo. Quantitative analysis using one-way ANOVA followed by Newman-Keuls test indicated that there was a significant increase in RAGE expression in the ethanol-control group compared to the water-control group, while post-treatment with AMP/SUL (200 mg/kg, but not 100 mg/kg) for five days decreased RAGE expression in the AcbSh. Ethanol-AMP/SUL (100 and 200 mg/kg) groups had higher RAGE expression compared to water-control group. The symbol of statistical significance between any group and water-control group is shown on the bar of the group. Water-control group data were represented as 100% (relative to water-control). The values are expressed as mean ± SEM (n = 5/group), (* p < 0.05, ** p < 0.01 and $ p < 0.001).

