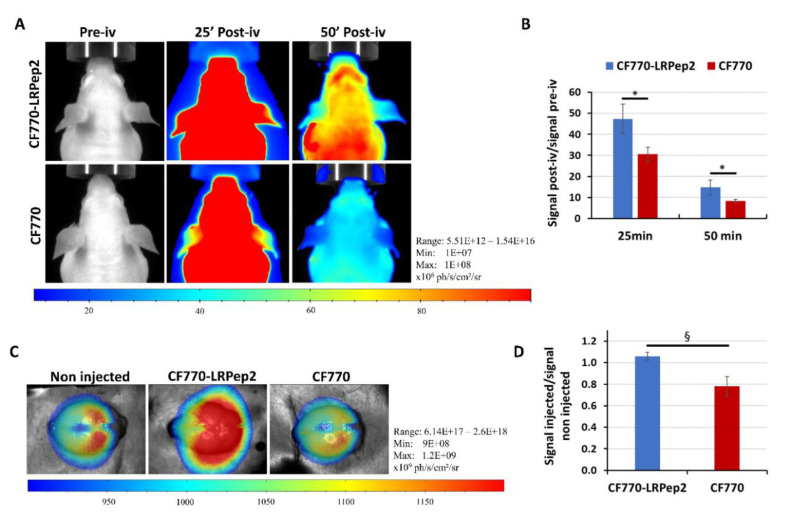
Figure 10.
(A) FLI images of the brains of nude mice before (pre-iv) and after injection of CF770-LRPep2 or CF770 (post-iv). (B) Analysis of the fluorescence observed on FLI images, measured by the M3Vision software in the brain area, and normalized to the pre-iv signal. * p < 0.05. (C) FLI images of mouse brains ex vivo. (D) Analysis of the fluorescence of the brains ex vivo normalized to the brain signal of a non-injected mouse. § p = 0.05.

