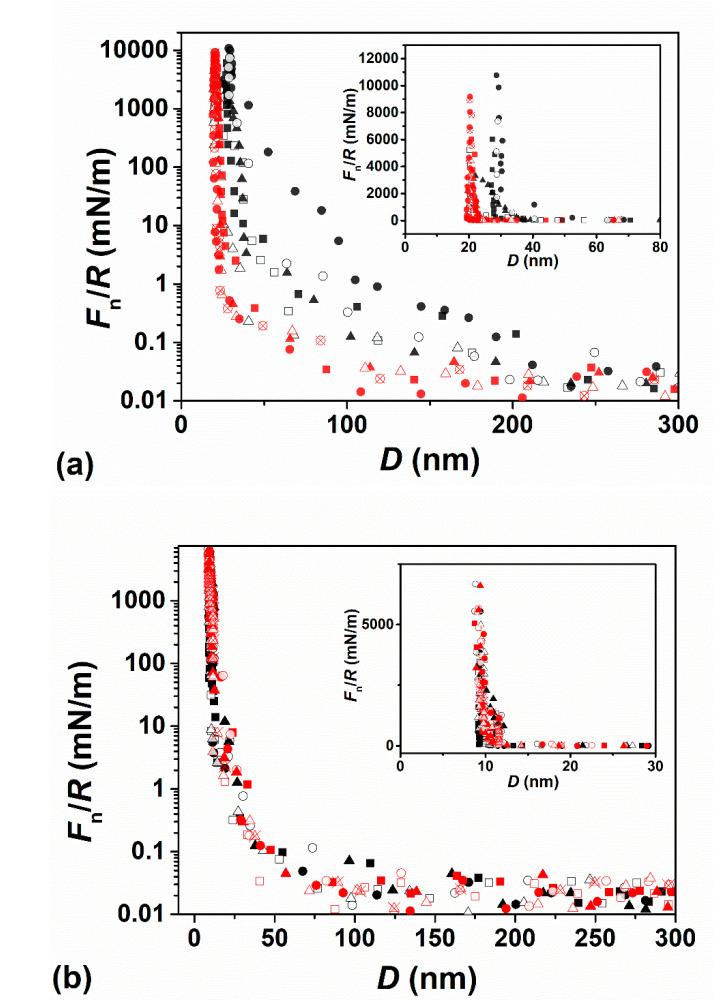
Figure 5.
(a) Normal force profiles Fn(D)/R versus separation D between two mica surfaces across pure water (black symbols) following overnight incubation in HSPC small unilamellar vesicle (SUV) dispersion (0.3 mM) followed by washing, and thereafter across HA solution (red symbols), normalized in the Derjaguin approximation by the mean radius of curvature of the mica sheets (R). (b) Normalized force profiles Fn(D)/R versus separation D between two mica surfaces across POPC dispersion (0.3 mM, black symbols) following overnight incubation, and then across the HA–POPC mixture (0.5 mg/mL:0.3 mM, red symbols). The zero of separation (D = 0) is with respect to air contact between bare mica surfaces. The insets show the ‘hard wall’ behavior on a larger, linear–linear scale with the same data points as in the main figure; in (a) the hard wall in HA-free water (black symbols) is generally at ca. 30 nm (and occasionally at ca. 20 nm), and in HA solution it is consistently at ca. 20 nm; in (b) the hard wall is at ca. 10 nm in both POPC dispersion and in the HA–POPC mixture. Different shaped symbols correspond to different contact positions based on 5 independent experiments with first approaches (filled symbols), second approaches (empty symbols), and receding profiles (crossed symbols).

