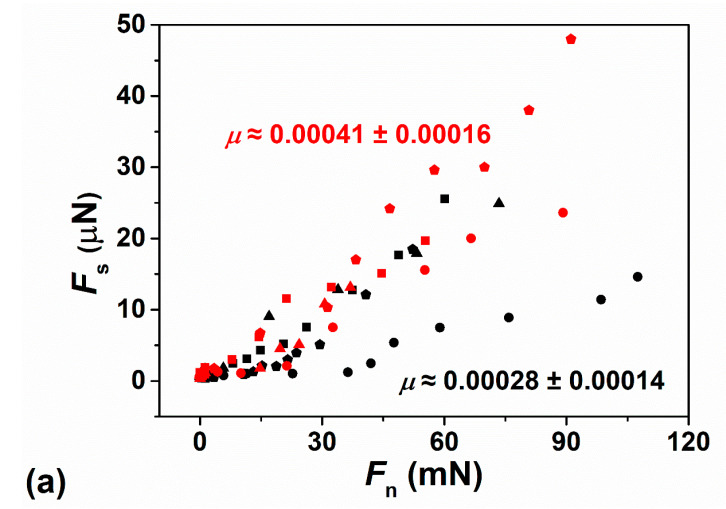
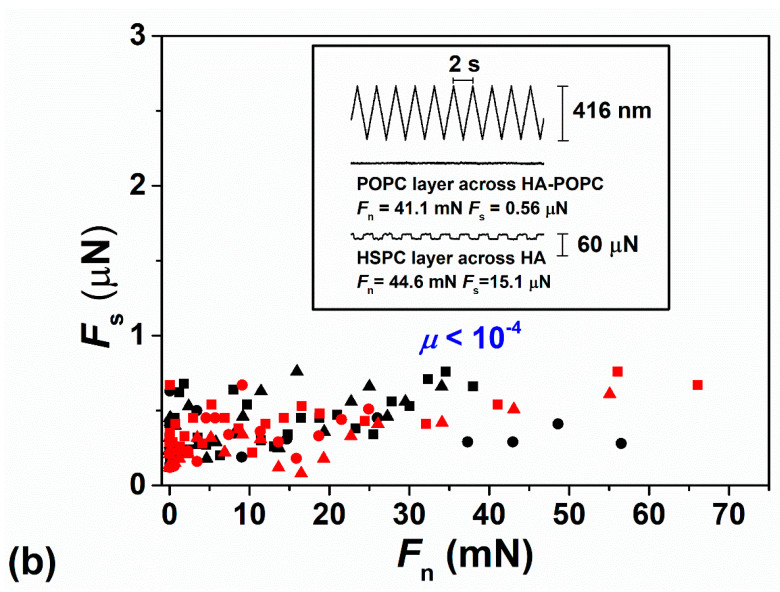
Figure 6.
(a) Frictional force Fs versus Fn between two mica surfaces across pure water following overnight incubation with HSPC SUVs dispersion (black symbols), where μ ≈ 0.00028 ± 0.00014, and across HA solution (red symbols), where μ ≈ 0.00041 ± 0.00016. (b) Frictional force Fs versus Fn between two mica surfaces across POPC SUVs dispersion following overnight incubation with POPC SUVs dispersion (black symbols) and across POPC-HA mixture (red symbols), where both of them showed μ < 0.0001. The inset shows directly measured shear traces Fs(t) for POPC layer across HA–POPC (2nd trace) and HSPC layer across HA (3rd trace) with similar normal force as a function of applied sliding motion (top trace). The low values of Fs are determined by fast Fourier transform of the shear traces [12].


