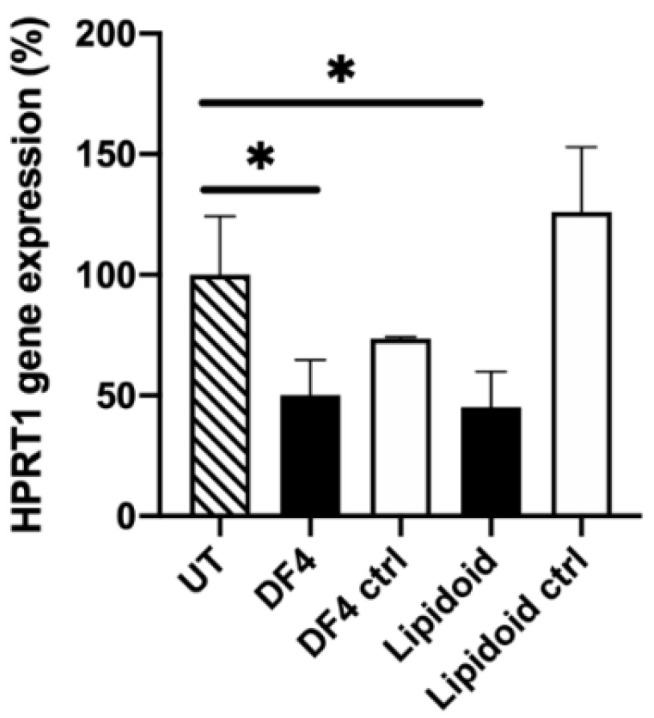
Figure 5.

HPRT1 mRNA knockdown in the differentiated primary pRPE cells, 2 days after transfection. Black columns indicate the HPRT1 siRNA (50 nM), the white columns indicate the negative control siRNA (50 nM). HPRT1 mRNA expression was evaluated with a qPCR and normalized to the endogenous GAPDH. Results are presented as the % of remaining gene expression. UT: untreated control cells; DF4: DharmaFect 4; ctrl: negative control siRNA; * indicates statistical significance (p < 0.05). Data are presented as mean + SD, n = 3.
