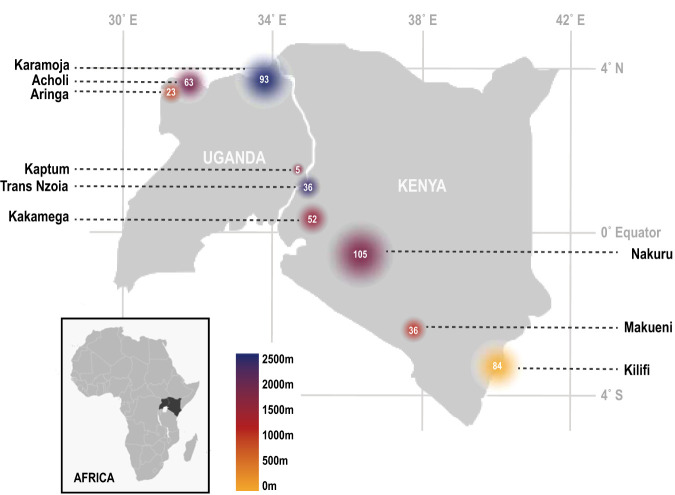
FIG 1.
Sampling localities and elevation, grouped by district (see Table S1 in the supplemental material for full locality information). Colors correspond to elevation, and white numbers and the size of circles correspond to the number of bats collected.

