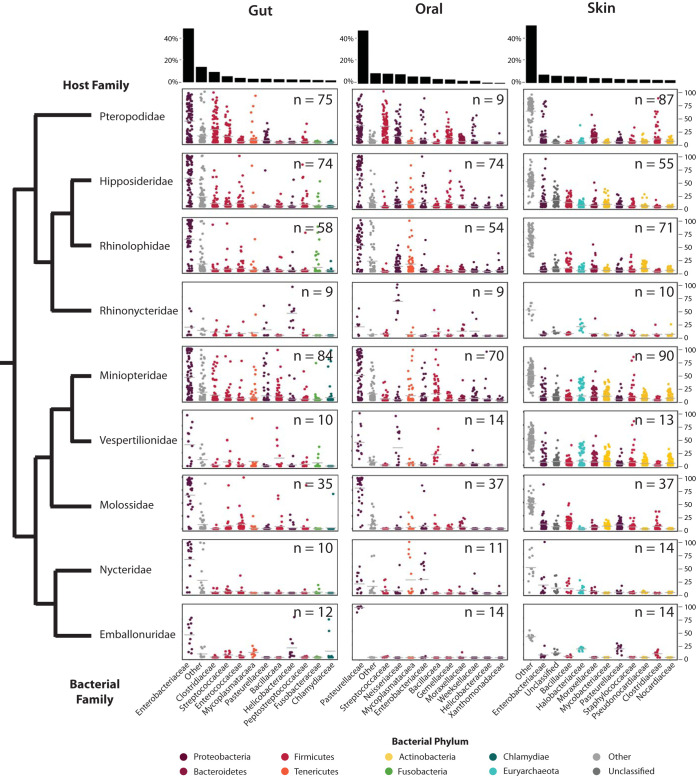
FIG 4.
Percent relative abundance of top 11 bacterial families identified in gut, oral, and skin microbiomes of bats. Points correspond to individual libraries. Bacterial families are colored according to bacterial phylum. The number of libraries is indicated in the top right-hand corner of each plot. The black bar graphs at the top of the figure indicate average relative abundances.

