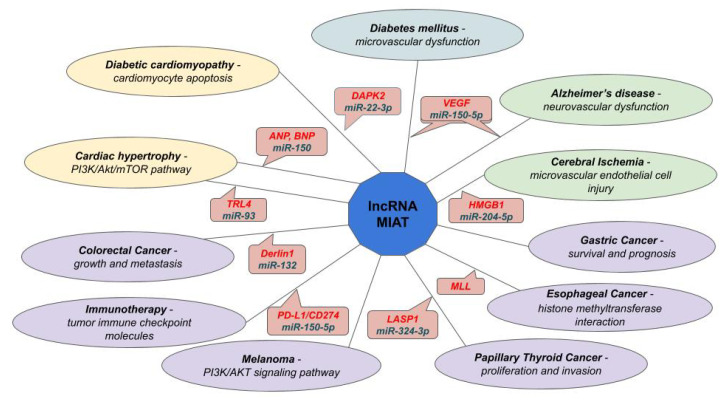
Figure 4.
Partial representation of regulatory interaction of lnc-myocardial infarction and associated transcript (MIAT): in ellipses, diseases are reported in bold and dysfunctions in italics; in comics, interacting ceRNAs, or influenced transcripts, are reported in italics red and miRNAs in italics blue. Different colors of ellipses are linked to different types of pathologies.

