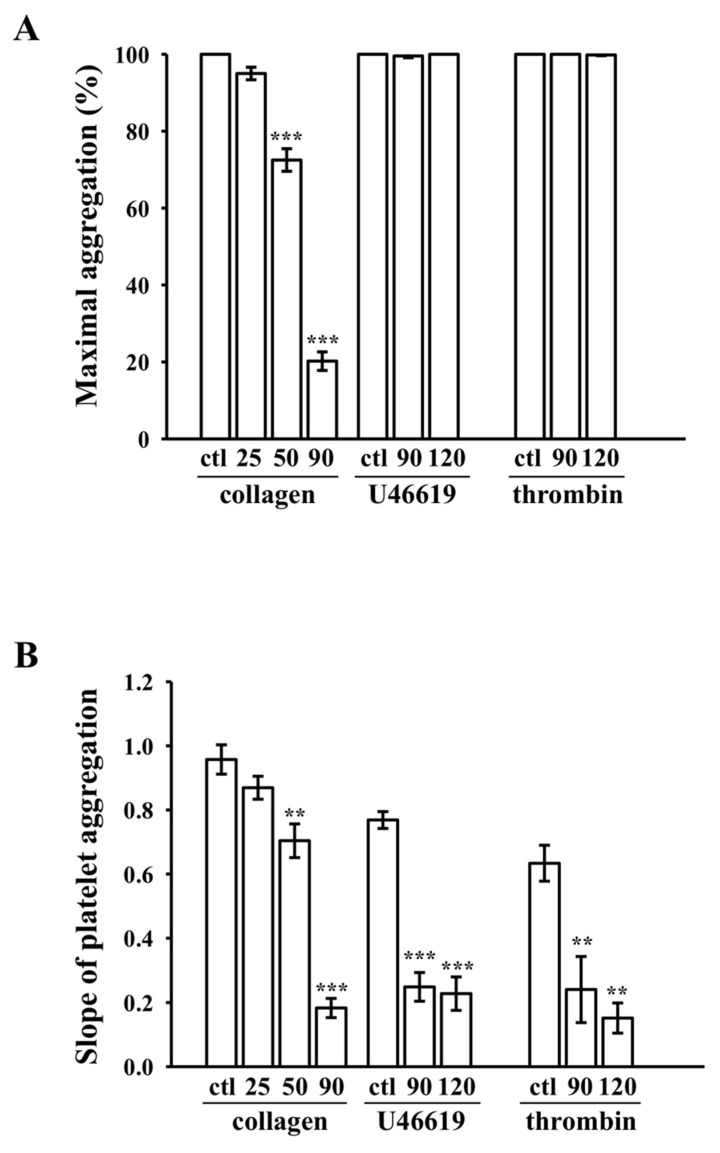
Figure 4.
Maximal aggregation and slope of aggregation curves. (A) Concentration-response bar diagrams of the synthesized CDOTs, demonstrating their inhibitory activity for maximal aggregation (%). (B) Slope of platelet aggregation, as calculated from the linear part of the aggregation trace. Values represent mean ± SEM (n = 4). ** p < 0.01 and *** p < 0.001, compared with the control (ctl; PBS-treated) group.

