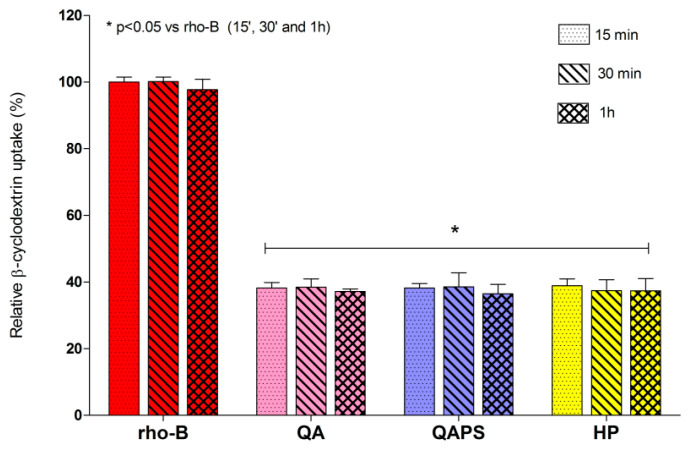
Figure 4.
Relative beta-cyclodextrin uptake in CACO-2 cells. Evaluation of the intracellular fluorescence in CACO-2 cells after exposure to RBITC-HP, RBITC-QA and RBITC-QAPS (5 µM) for 15, 30 and 60 min. Data are reported as mean ± SD (n = 3). * p < 0.05 vs. rho-B 0.5 µM at 15, 30 and 60 min (ANOVA test).

