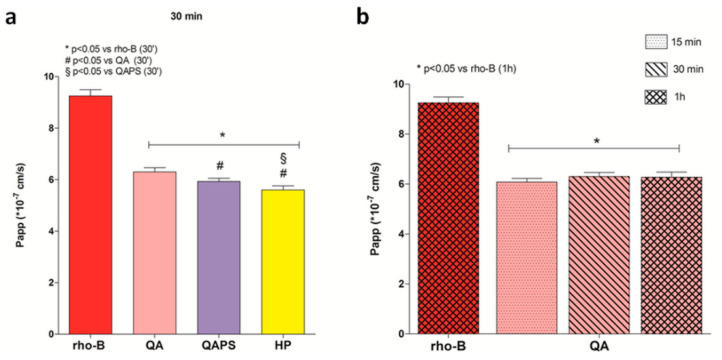
Figure 6.
Evaluation of transepithelial permeability of RBITC-HP, RBITC-QA and RBITC-QAPS in CACO-2 cell monolayers. (a) The apparent permeability (Papp) values at 30 min. * p < 0.05 vs. rho-B; # p < 0.05 vs. RBITC-QA; § p < 0.05 vs. RBITC-QAPS (ANOVA test). (b) The apparent permeability (Papp) of RBITC-QA at 15, 30 and 60 min. * p < 0.05 vs rho-B (ANOVA test). Data are reported as mean ± SD (n = 3).

