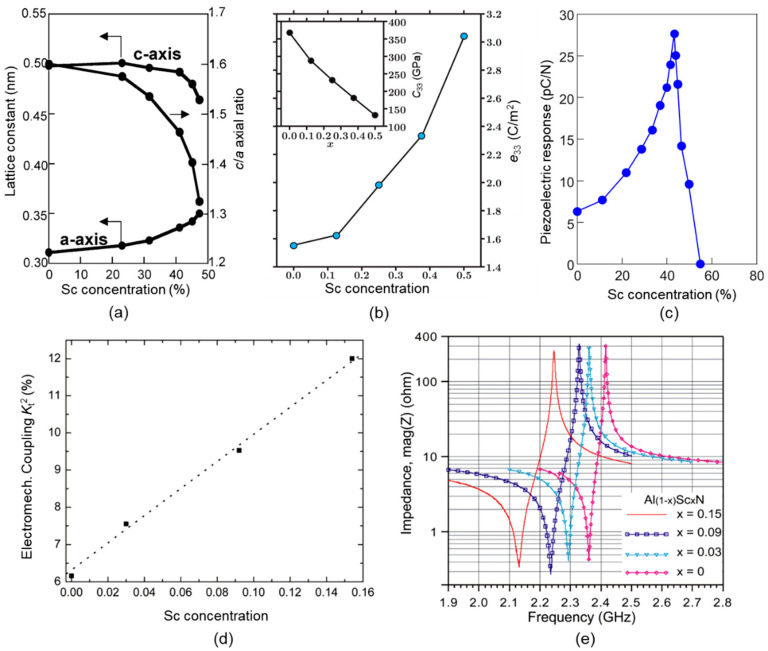
Figure 9.
Effects of different Sc doping concentrations. (a) Lattice constant a, c, c/a value, reproduced with permission from [26]. (b) Piezoelectric constant e33 and stiffness coefficient c33, reproduced with permission from [46]. (c) Piezoelectric strain coefficient d33, reproduced with permission from [45]. (d) Electromechanical coupling coefficient kt2, reproduced with permission from [65]. (e) Measured FBAR impedance curve, reproduced with permission from [65].

