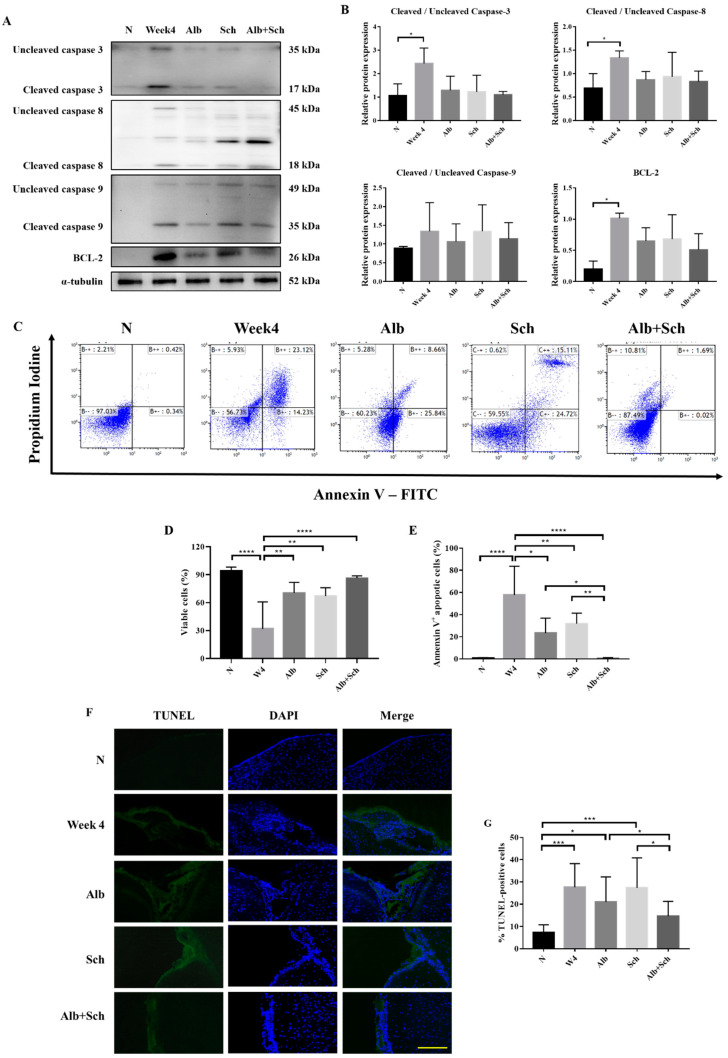
Figure 4.
Alb-Sch B co-therapy inhibits apoptosis in A. cantonensis-infected mice. (A) Representative western blot images reflecting protein levels of Caspase-3, Caspase-8, Caspase-9, and BCL-2. (B) Bar graphs showing protein expression levels relative to that of α-tubulin. Results are presented as the mean ± SD (n = 3). (C) Representative plots from one set of Annexin V-FITC and PI double staining, measured by flow cytometry. Viable cells are shown in the bottom left quadrant (double negative); early apoptotic cells are shown in the bottom right quadrant (Annexin V positive and PI negative); late apoptotic cells are shown in the upper right quadrant (double positive). (D) Percentages of viable cells, shown as the mean ± SD (n = 5). (E) Percentages of apoptotic cells (including both early apoptotic and late apoptotic cells) are shown as the mean ± SD (n = 5). (F) Representative microphotographs of TUNEL staining. Scale bar, 200 μm. (G)Percentages of TUNEL-positivecells, quantitated by counting ratio of TUNEL/DAPI in 5 random microscopic fields, shown as mean±SD (n = 3). * p-value < 0.05, ** p-value < 0.01, *** p-value < 0.001, and **** p-value < 0.0001.

