Figure 3.
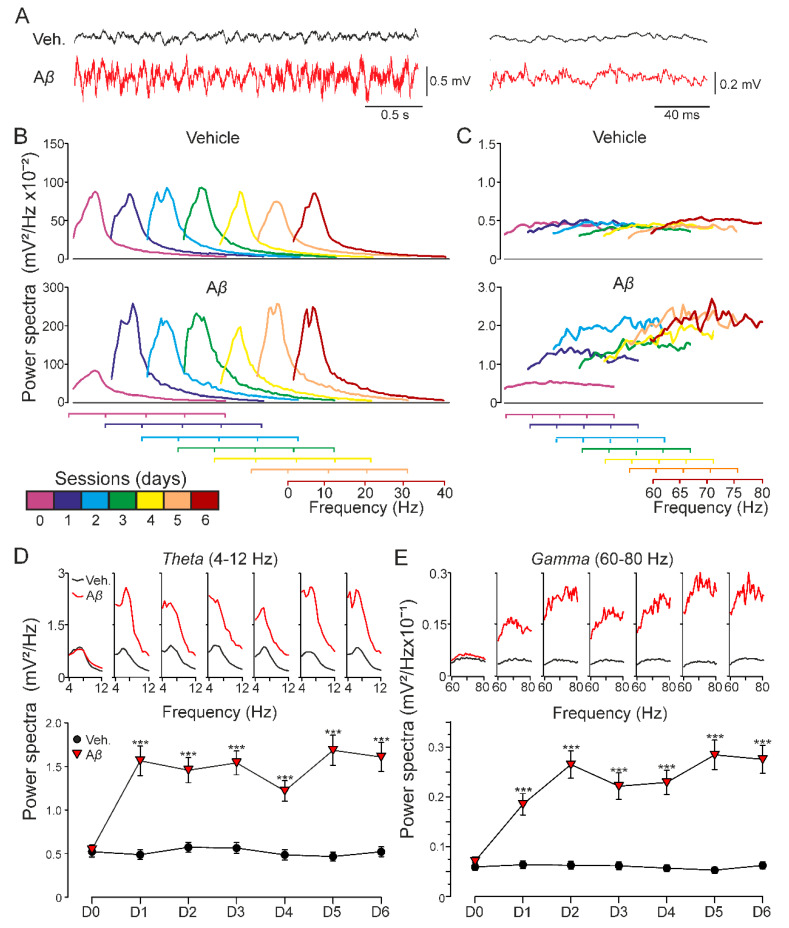
Oscillatory activity in CA1 region of behaving mice. Spectral power of 180 s LFP recordings at the CA1 area obtained on 6 consecutive days in the absence of any electrical stimulation for two experimental groups: vehicle and Aβ25–35. (A) Representative example of LFP recorded from CA1 hippocampal region in behaving mice. Note the different time scales for the traces illustrated on the left and right. (B) Low-frequency and (C) high-frequency bands were analyzed. Recordings on day 0 were collected previous to icv. administration (purple). Injections were performed on days 1, 2, and 3, recording 1 h after each one. LFP evolution was also followed 24, 48, and 72 h post icv. (days 4–6). Additionally, each day (D0-D6) spectral power of frequency intervals corresponding to hippocampal theta ((D); 4–12 Hz) and gamma ((E); 60–80 Hz) bands is represented (on top) along with the average value for that interval (below; mean ± SEM). After icv. administration, Aβ-injected mice showed increased spectral power at both low and high frequencies compared to vehicle-injected animals, and the same result was found for theta and gamma rhythms. *** p < 0.001.

