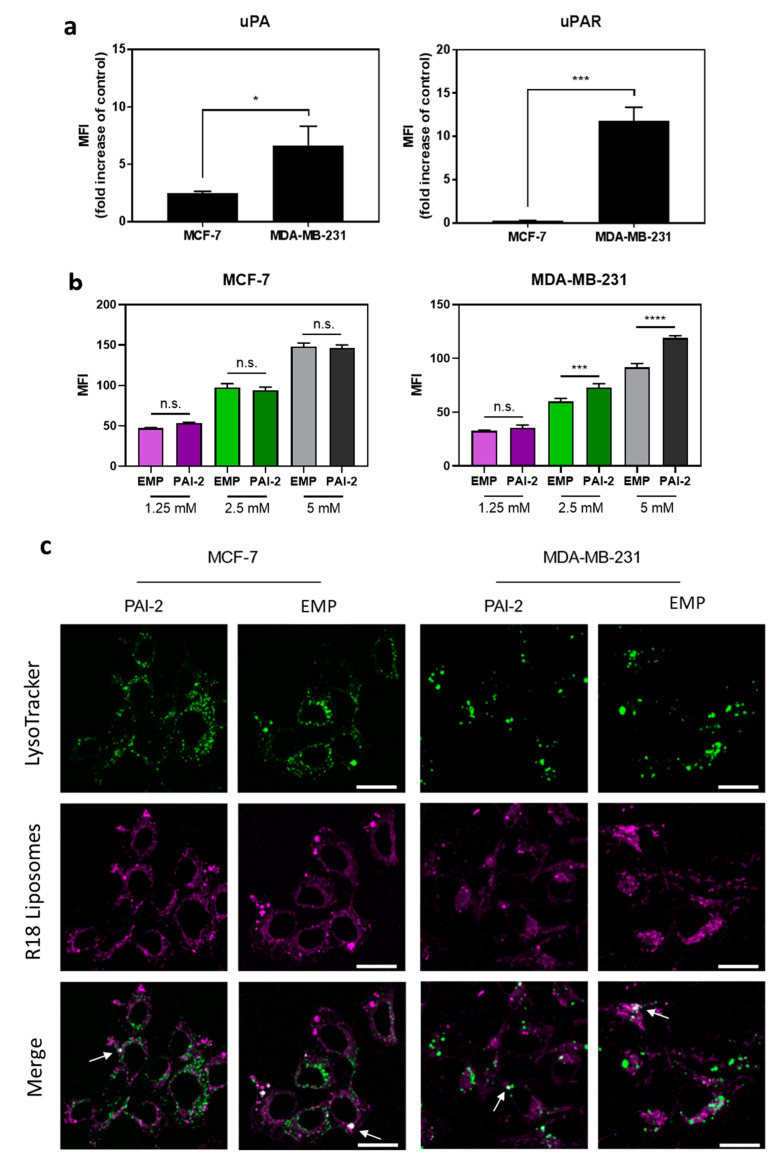
Figure 2.
Cell surface expression of uPA/uPAR and cellular uptake of PAI-2 FITC-labelled liposomes by breast cancer cells. (a) MCF-7 cells and MDA-MB-231 cells were incubated with antibodies against human urokinase plasminogen activator (uPA), its receptor (uPAR), or an isotype control antibody (IgG) and cell surface expression analyzed by flow cytometry. (b) MCF-7 cells (left) and MDA-MB-231 cells (right) were incubated with empty non-functionalized (EMP) FITC liposomes or empty PAI-2-functionalized (PAI-2) FITC liposomes for 45 min, and were analyzed by flow cytometry. MFI = mean fluorescence intensity Data are the mean ± s.d. (n = 3). *: p < 0.05; ***: p < 0.001; ****: p < 0.0001; n.s. = not significant (p > 0.05). (c) EMP liposomes and PAI-2 liposomes were labelled with R18 and incubated with cells at a liposome concentration of 2.5 mM for 1 h. LysoTracker green was added to visualize lysosomes. Arrows point to white foci, which indicate colocalization of green and magenta signals. Representative images are shown. Scale bars are 25 µm.

