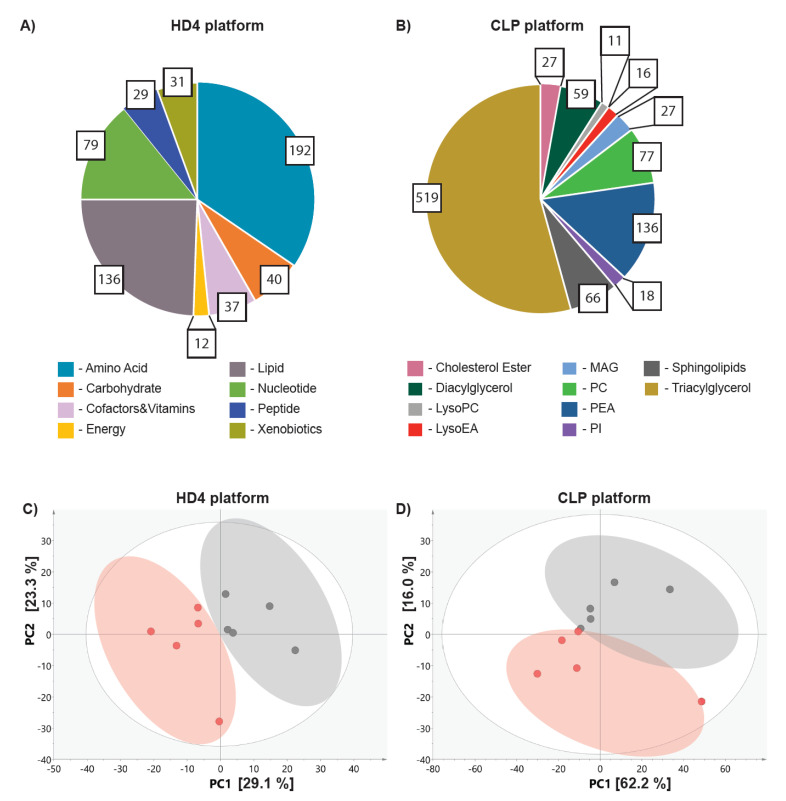
Figure 2.
Doxorubicin triggers changes in tumor metabolism in ovo. Pie chart reflective of the number of metabolites measured on HD4 platform (A) and CLP (B), representing the numerical proportion of each metabolic class. The colors of the pie fractions represent different metabolic classes measured on the HD4 or CLP platform. The PCA analysis of metabolites measured on HD4 (C) and CLP (D) reveal the separation between the vehicle (depicted in grey) treated and doxorubicin (depicted in red).

