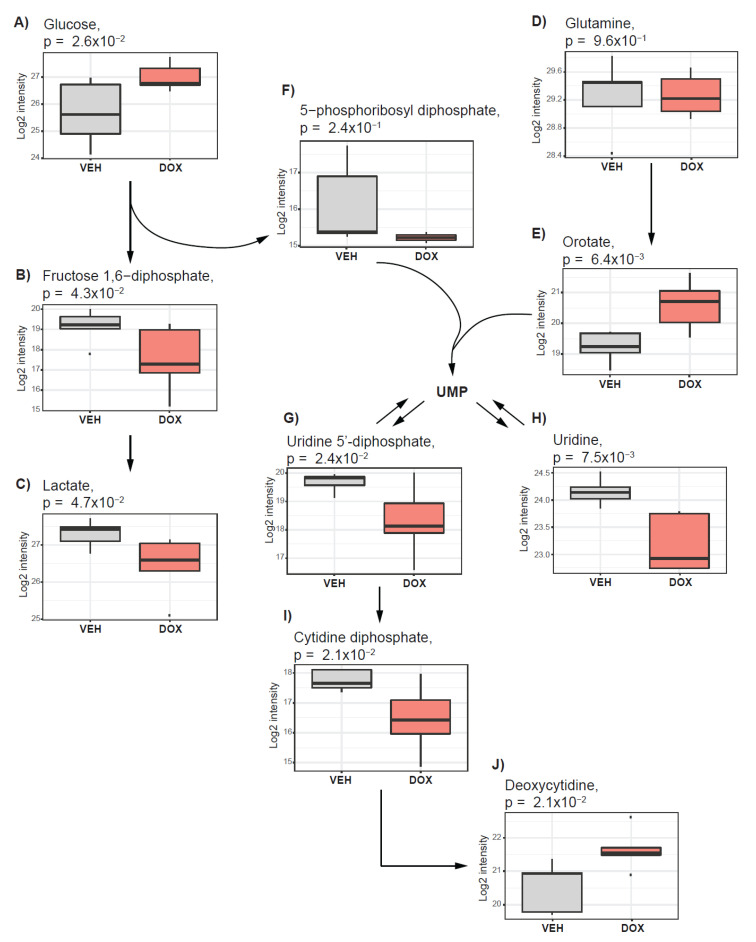
Figure 3.
Doxorubicin treatment suppresses glycolysis and nucleotide synthesis. The boxplots represent alterations in glycolysis and nucleotide synthesis after treatment of in ovo tumors with doxorubicin. Alterations in (A) Glucose, (B) Fructose 1,6-diphosphate, (C) lactate, (E) Orotate, (G) Uridine 5’-diphosphate, (H) Uridine, (I) Cytidine diphosphate, and (J) Deoxycytidine are nominally significant. (D) Glutamine and (F) 5-phosphoribosyl-diphosphate are not impacted by doxorubicin treatment. Vehicle-treated tumors (VEH) are depicted in grey, and those treated with doxorubicin (DOX) are indicated in red.

